Monitoring and logging filters
28 minute read
Log message payload filter
The Log Message Payload filter is used to log the message payload at any point in the policy. The message payload includes the HTTP headers and MIME attachments.
By placing the Log Message Payload filter at various key locations in the policy, a complete audit trail of the message can be achieved. For example, by placing the filter after each filter in the policy, the complete history of the message can be logged. This is especially useful in cases where the message has been altered by the API Gateway (for example, by signing or encrypting the message, inserting security tokens, or by converting the message to another grammar using XSLT).
Log messages can be stored in several locations, including a database, a file, or the system console. For more details on configuring logging destinations, see Configure logging and events.
Enter an appropriate name for the Log Message Payload filter in the Name field. It is good practice to use descriptive names for these filters. For example, Log message before signing message and Log message after signing would be useful names to give to two Log Message Payload filters that are placed before and after a Sign Message filter.
By default, the Log Message Payload filter writes entries to the log file in the following format:
${timestamp} ${id} ${filterName} ${payload}
However, you can alter the format of the logging output using the values entered in the Format field. You can use selectors to output logging information that is specific to the request. You can specify the following properties:
level: The log level (i.e. fatal, fail, success).id: The unique transaction ID assigned to the message.ip: The IP address of the client that sent the request.timestamp: The time that the message was processed in user-readable form.filterName: The name of the filter that generated the log message.filterType: The type of the filter that logged the message.text: The text of the log message that was configured in the filter itself.payload: The complete contents of the HTTP request, including HTTP headers, body, and attachments.
Set transaction log level and log message for a filter
By default, logging is configured for a service with logging level of failure. You can also configure each filter in a policy to log its own message depending on whether it succeeds, fails, and/or throws an exception. Log messages can be stored in several locations, including a database, a file, or the system console.
Logging levels apply to the following cases:
- A filter succeeds if it returns a true result after carrying out its processing. For example, if an LDAP directory returns an
authorizedresult to an authorization filter, the filter succeeds. - A filter fails if it returns a false result after performing its processing. For example, an authorization filter returns false if an LDAP directory returns a
not authorizedresult to the filter. - A filter aborts when it cannot make the decision it is configured to make. For example, if an LDAP-based authorization filter cannot connect to the LDAP directory, it aborts because it can neither authorize nor refuse access. This is regarded as a fatal error.
You can access the Transaction Log Level and Message window by clicking Next on the main window of any filter. This window includes the following fields:
Logging Level: Configure one of the following options:
- Use Service Level Settings: This option is selected by default. Logging is configured for the Web service with logging level of Failure.
- Override Logging Level for this Filter: Alternatively, select this option to configure log messages for this filter when it succeeds, fails, and/or aborts. Select Success, Failure, and/or Fatal to configure this filter to log at the respective levels.
Log Messages: Default log message values are provided at each level for all filters. When you select the checkbox for a particular level, the default log message for that level is used. You can specify an alternative log message by entering the message in the text field provided.
All filters require
and generate
message attributes, while some consume
attributes. In some cases, it may be useful to log the value of these attributes. For example, instead of an authentication filter logging a generic Authentication Failed
message, you can use the value of the authentication.subject.id
attribute to log the ID of the user that could not be authenticated.
Use the following format to enter a message attribute selector in a log message:
${name_of_attribute}
At runtime, the API Gateway expands these selectors to the value of the message attribute. For example, to make sure the ID of a non-authenticated user is logged in the message, enter something like the following in the text field for the Failure case:
The user '${authentication.subject.id}' could not be authenticated.
Then if a user with ID MadCap:variable name="api_gateway_variables.lc_company"/>
cannot be authenticated by the API Gateway (a failure case), the following message is logged:
The user 'axway' could not be authenticated.
Transaction Logging Behavior: This setting is relevant only in cases where you have configured the API Gateway to log audit trail messages to a database.
You can select Abort policy processing on database log error if you have configured the API Gateway to write log messages to a database, but that database is not available at runtime. If you have selected this setting, and the database is not available, the filter aborts, which in turn causes the policy to abort. In this case, the Fault Handler for the policy is invoked.
Filter Category: The category selected here identifies the category of filters to which this filter belongs. The default selection should be appropriate in most cases.
Service level agreement filter
A service level agreement (SLA) is an agreement put in place between a web services host and a client of that web service in order to guarantee a certain minimum quality of service. It is common to see SLAs in place to ensure that a maximum number of messages do not result in a communications failure and that responses are received within an acceptable time frame. In cases where the conditions of the SLA are breached, it is crucial that an alert can be sent to the appropriate party.
When one of the specified thresholds is breached, an alert is sent to a configured alert destination to ensure that interested parties are notified promptly of the SLA breach. For more details on configuring system alerts, see the Configure system alerts.
API Gateway satisfies these requirements by allowing SLAs to be configured at the policy level. You can configure SLAs to monitor the following types of problems:
- Response times
- HTTP status codes returned from the web service
- Communication failures
The SLA monitoring performed by API Gateway is statistically driven. Alerting is not based on a single message (or even a small number of messages) as the sample size is considered insufficient for the algorithm to return meaningful results. The monitoring engine uses an exponential decay algorithm to determine whether an SLA is failing or not.
The filter exposes 3 parameters that directly affect the workings of the underlying algorithm:
- Minimum sample size: The minimum required number of samples that must be present in the cache during a poll interval so that the algorithm can consider them significant enough to warrant an alert being raised when the configured ‘requirements’ have been breached.
- Poll rate (milliseconds): The rate at which the algorithm is executed against the samples present in the cache. The default value is
30000(30 seconds). - Data Age Estimate (milliseconds): The time period during which historical data should remain significant. The default value is
600000(10 minutes).
Decay algorithm numerical examples
Exponential decay is generally calculated with the help a decay-rate function. The decay rate in this instance should be considered a percentage. The SLA filter uses the following formula:
decayRate = 2 / ( dataAge / pollRate + 1)
The count during each poll interval is calculated using the following equation:
newCount = agedCount * (1 - decayRate) + count * decayRate;
where,
countrefers to the number of samples obtained during the current poll interval.agedCountrefers to the historical data calculated over previous poll intervals, with decay taken into account.newCountis the updated sample count with new data (for example,count) combined with historical data (for example,agedCount).
After the poll interval has elapsed, newCount becomes agedCount and the equation is calculated again when poll interval is next triggered.
Example of complete decay
The following are the parameters for this example:
| Parameter | Value |
|---|---|
pollRate |
1000ms (1 second) |
dataAge |
1000ms (1 second) |
decayRate |
Calculated as 2 / (1000 / 1000 + 1) = 2 / 2 = 1 |
A decayRate of 1 signifies complete decay, meaning all historical data has expired. This implies historical samples do not apply any weight to the overall result. Using the equation above it is evident that historical samples do not factor into the calculation of newCount. Only results from the current poll interval are included, for example:
newCount = agedCount * (1 - decayRate) + count * decayRate
newCount = agedCount * (1 - 1) + count * 1
newCount = count
Note
The closer thedataAge is to pollRate, the less significant historical data becomes, and the more significant the “last” sample becomes.
Example of slow decay
The following are the parameters for this example:
| Parameter | Value |
|---|---|
pollRate |
1000ms (1 second) |
dataAge |
100000ms (100 seconds) |
decayRate |
Calculated as 2 / (100000 / 1000 + 1) = 2 / 101 ≅ 0.02 |
A decayRate of 0.02 signifies slow decay, meaning historical data is important, yet samples from the current poll interval carry little weight in the overall result. Using the equation above it is evident that historical samples factor greatly in the calculation of newCount, whereas the newest samples are less significant.
newCount = agedCount * (1 - decayRate) + count * decayRate
newCount = agedCount * (1 - 0.02) + count * 0.02
newCount = agedCount * (0.98) + count * 0.02
newCount ≅ agedCount + (small input from the current poll interval)
Example of insufficient samples
The following are the parameters for this example:
| Parameter | Value |
|---|---|
minimumSampleSize |
100 |
pollRate |
3000ms (3 seconds) |
dataAge |
6000ms (6 seconds) |
decayRate |
Calculated as 2 / (6000 / 3000 + 1) = 2 / 3 ≅ 0.66 |
threshold |
At least 60% 200 OK responses |
throughput |
10tps |
In this example the throughput of the back-end webservice is 10 transactions per second. The following table illustrates how the algorithm fails to achieve the minimum sample size to perform the analysis and trigger the alert.
| Time (ms) | Calculations |
|---|---|
| 0 | Traffic commences |
count = 0agedCount = 0 |
|
| 3000 | By the first poll interval ~30 samples have been gathered (10tps * 3 seconds). Insufficient sample count |
newCount = agedCount * (1 - decayRate) + count * decayRatenewCount = 0 * (1 - 0.66) + 30 * 0.66newCount = 0 + 20newCount = 20 |
|
| 6000 | By the next poll interval another ~30 samples have been gathered, and so on. Insufficient sample count |
newCount = agedCount * (1 - decayRate) + count * decayRatenewCount = 20 * (1 - 0.66) + 30 * 0.66newCount = 6.8 + 20newCount = 26.8 |
|
| 9000 - 21000 | Insufficient sample count. Calculated values for newCount shown |
At 9000 newCount = 29.11At 12000 newCount = 29.9At 15000 newCount = 30.17At 18000 newCount = 30.26At 21000 newCount = 30.28 |
|
| 24000 | From this point onwards newCount only grows a negligible amount each time the cache of samples is polled, and never reaches the minimum samples size required in order to check to see if the SLA has been breached. |
newCount = agedCount * (1 - decayRate) + count * decayRatenewCount = 30.28 * (1 - 0.66) + 30 * 0.66newCount = 10.3 + 20newCount = 30.3 |
Example of alert triggered
The following are the parameters for this example:
| Parameter | Value |
|---|---|
minimumSampleSize |
100 |
pollRate |
10000ms (10 seconds) |
dataAge |
6000ms (6 seconds) |
decayRate |
Calculated as 2 / (6000 / 10000 + 1) = 2 / 1.6 ≅ 1.25 |
threshold |
At least 60% 200 OK responses |
throughput |
10tps |
Let’s assume that the webservice being used returns a 400 Bad Request response approximately 40-45% of the time.
| Time (ms) | Calculations |
|---|---|
| 0 | Traffic commences |
count = 0agedCount = 0 |
|
| 10000 | By the first poll interval ~100 samples will have been gathered (10tps * 10 seconds). Assume no SLA breach at this stage |
newCount = agedCount * (1 - decayRate) + count * decayRatenewCount = 0 * (1 - 1.25) + 100 * 1.25newCount = 0 + 125newCount = 125 |
|
| 20000 | Insufficient sample count |
newCount = agedCount * (1 - decayRate) + count * decayRatenewCount = 125 * (1 - 1.25) + 100 * 1.25newCount = -31.25 + 125newCount = 93.75 |
|
| 30000 | Sufficient samples. No SLA breach |
newCount = agedCount * (1 - decayRate) + count * decayRatenewCount = 93.75 * (1 - 1.25) + 100 * 1.25newCount = -23.44 + 125newCount = 101.56 |
|
| 40000 | Insufficient sample count. |
newCount = agedCount * (1 - decayRate) + count * decayRatenewCount = 101.56 * (1 - 1.25) + 100 * 1.25newCount = -25.39 + 125newCount = 99.61 |
|
| 50000 | SLA breached! |
newCount = agedCount * (1 - decayRate) + count * decayRatenewCount = 99.61 * (1 - 1.25) + 100 * 1.25newCount = -24.9 + 125newCount = 100.1 |
As illustrated by the examples in this section, to generate an alert there must be sufficient samples at each poll interval to consider the data to be statistically valid. For example, if a single request arrives over a period of one hour it might not be fair to say that “less than 20%” of all received requests have failed the response time requirements. For this reason, statistical analysis provides a more realistic SLA monitoring mechanism than a solution based purely on absolute metrics.
Response time requirements
You can monitor the response times of web services protected by the SLA Filter. This filter provides different ways of measuring response times:
| Response Time Measurement | Description |
|---|---|
| receive-request-start | The time that the API Gateway receives the first byte of the request from the client. |
| receive-request-end | The time that the API Gateway receives the last byte of the request from the client. |
| send-request-start | The time that the API Gateway sends the first byte of the request to the web service. |
| send-request-end | The time that the API Gateway sends the last byte of the request to the web service. |
| receive-response-start | The time that the API Gateway receives the first byte of the response from the web service. |
| receive-response-end | The time that the API Gateway receives the last byte of the response from the web service. |
| send-response-start | The time that the API Gateway sends the first byte of the response to the client. |
| send-response-end | The time that the API Gateway sends the last byte of the response to the client. |
API Gateway measures each of the 8 time values. They are available for processing after the policy has completed for a single request. These 8 options are available for the following reasons:
- API Gateway might start to send the first byte to the web service before the last byte is received from the client (send-request-start < receive-request-end). This occurs if the invoked policy does not require the full message to be read into memory.
- API Gateway might start to send the response to the client before the complete response has been received from the web service (send-response-start < receive-response-end). This occurs when invoked policy does not require the full message to be read into memory.
- It is possible that the web service might start to send the response before it has received the complete request. However, API Gateway does not start to read the response until it has sent the complete request. This means that the following is always true: send-request-end < receive-response-start.
- The time value for send-response-end depends upon the client application. This value is larger if the client is slow to read the response.
To add a response time requirement for an SLA, click Add.
To configure the start time and end time for the response time measurement, click Add. On the Settings tab, specify the percentage of response times that must be below a specified time interval (in milliseconds) in the fields provided. The purpose of these options is to allow for situations where a very small number of unusually slow requests might cause an SLA to trigger unnecessarily. By using percentages, such requests do not distort the statistics collected by API Gateway.
Click the Message Text tab to configure the messages to appear in the alert message when the SLA is breached and also when the SLA is cleared, that is, when the breached conditions are no longer in breach of the SLA.
Finally, click the Advanced tab to configure timing information. Select a Start Timing Point from the 8 times listed in the table above. API Gateway starts measuring the response time from this time. Then select an End Timing Point from the 8 times listed in the table above. API Gateway stops measuring the response time from this time.
HTTP status requirements
HTTP status codes might be received from a web service. API Gateway can be configured to monitor these and generate alerts based on the number of occurrences of certain types of status code response. HTTP status codes are three digit codes that can be grouped into standard status classes, with the first digit indicating the status class.
The status classes are as follows:
| HTTP Status Code Class | Description |
|---|---|
| 1xx | These status codes indicate a provisional response. |
| 2xx | These status codes indicate that the client’s request was successfully received, understood, and accepted. |
| 3xx | These status codes indicate that further action needs to be taken by the user agent in order to fulfill the request. |
| 4xx | These status codes are intended for cases in which the client seems to have erred. For example 401, means that authentication has failed. |
| 5xx | These status codes are intended for cases where the server has encountered an unexpected condition that prevented it from fulfilling the request. For example, 500 is used to transmit SOAP faults. |
API Gateway might monitor a class (that is, range) of status codes, or it might monitor specific status codes. For example, it is possible to configure the following HTTP status code requirements:
- At least 97% of the requests must yield HTTP status codes between 200 and 299
- At most 2% of requests can yield HTTP status codes between 400 and 499
- At most 0% of requests can yield HTTP status code 500
Click Add in the HTTP Status Code Requirements section.
Select an existing status code or class of status codes from the HTTP Status Code field. To add a new code or range of codes, click Add.
Enter a name for the new code or range of codes in the Name field of the Configure HTTP Status Code dialog. Enter the first HTTP status code in the range of status codes that you want to monitor in the Start Status field. Then enter the last HTTP status code in the range of status codes that you want to monitor in the End Status field.
To monitor just one specific status code, enter the same code in the Start Status and End Status fields.
Click OK when you are satisfied with the selected range of status codes to return to the previous dialog. The remaining 2 fields allow the administrator to specify the minimum or maximum percentage of received HTTP status codes that fall into the configured range before an alert is triggered.
Again, the use of percentages here is to allow for situations where a very small number of requests return the status codes within the “forbidden” range. By using percentages, such requests do not distort the statistics collected by API Gateway.
Click the Message Text tab to configure the messages to appear in the alert message when the SLA is breached and also when the SLA is cleared, (when the breached conditions are no longer in breach of the SLA).
Communications failure requirements
API Gateway is deemed to have experienced a communications failure when it fails to connect to the web service, fails to send the request, or fails to receive the response.
The requirements for communications failures can be expressed as follows:
- No more than 4% of requests can result in communications failures.
Enter the percentage of allowable communications failures in the field provided. An alert is configured if the percentage of communicates failures rises above this level.
Click the Message Text tab to configure the messages to appear in the alert message when the SLA is breached and also when the SLA is cleared (when the breached conditions are no longer in breach of the SLA).
Select alerting system
If an alert is triggered, it must be sent to an alerting destination. API Gateway can send alerts to the following destinations:
- Windows Event Log
- Email Recipient
- SNMP Network Management System
- Local Syslog
- Remote Syslog
- CheckPoint FireWall-1 (OPSEC)
The Select Alerting System table at the bottom of the window displays all available alerting destinations that have been configured. You can click Add to configure an alert destination.
Select one or more alerting systems in the table. An alert is sent to each selected system in the event of a violation of the performance requirements. Alert clearances will be generated when the violation no longer exists.
Alert filter
You can use the Alert filter to send system alerts to different alert destinations, for example, when another filter fails, or in API firewalling when ModSecurity detects a threat. For more details on system alerts and alert destinations, see Configure system alerts.
Typically, an Alert filter is placed on the failure path of another filter in the policy. In the following example, an alert is configured if a schema validation fails 10 times within a 5000 millisecond period for a specified web service, and the Alert filter is placed on the failure path from the Schema Validation filter:
When editing policies, you can drag and drop the Alert filter onto the policy canvas from the Monitoring category.
Configure the following settings on the Alert filter window:
- Name: Enter a descriptive name for the filter to display in a policy, especially more complicated policies might have several alert filters so good names make it easier to tell them apart.
- Alert Type: Select the severity level of the alert (Error, Warn, or Info). This option is only relevant for alert destinations that support severity levels, such as the Windows Event Log.
Notifications settings
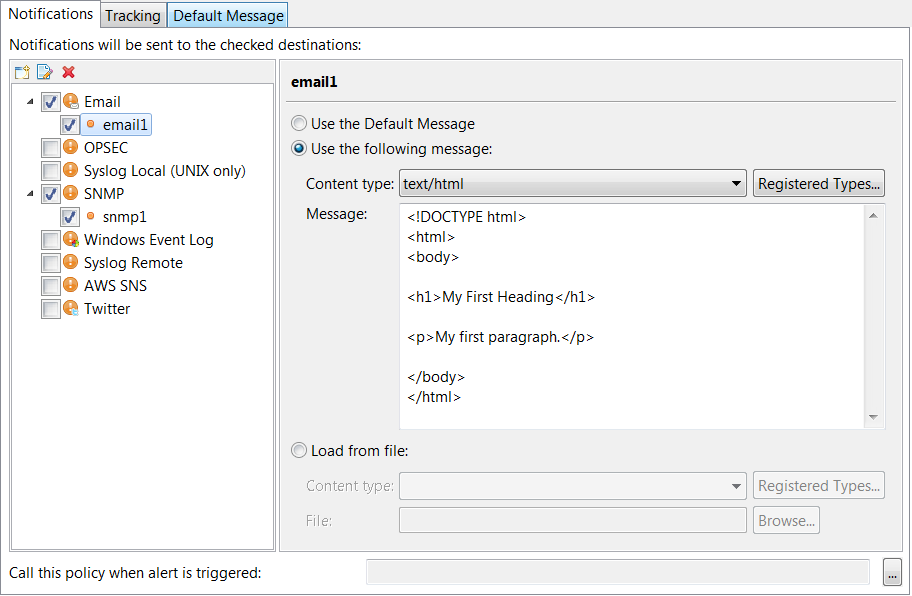
You can configure the alert destination on the Notifications tab. The alert destinations you have already configured are nested under the respective alert destination type on the left of the window. You can also use the icons above the alert destination listing to create, edit, or delete alert destinations directly from this window.
To select an alert destination, follow these steps:
-
Select an alert destination or all alert destinations of a given alert destination type (for example, all Email destinations).
-
Set the message that is sent to the alert destination:
- Select Use the following message, set the content type, and enter a custom message in the text box.
- Select Use the Default Message, and go to the Default Message tab to write the message you want to send.
- Select Load from file, set the content type, and browse to the file you want to use (this option is available for email destinations only).
To register new MIME content types, click the Registered Types button.
The following figure shows an example of an email alert destination with a text/html custom message.
Tracking settings
Use the Tracking tab to configure how often alerts are sent. Configure the following:
- Accumulated number of messages: Enter how many times this filter can be invoked before the alert is sent. The default value is
1. - In time period (secs): Enter the time period over which the accumulated number of messages can occur before an alert is triggered. The default is
60seconds. - Track per client: Select this option to record the accumulated number of messages in the specified time period for each client. This option is selected by default.
Default message
Enter the default message used for alerts in Message to send on the Default Message tab.
Note
An alert message is not required for alerts sent to an OPSEC firewall.You can include message attributes using selectors that API Gateway looks up and expands at runtime. For example, instead of sending a generic alert stating Authentication Failed, you can use a message attribute to include the ID of the user whose authentication failed:
Authentication failure for user:${authentication.subject.id}.
${alert.number.failures} authentication failures have occurred in ${alert.time.period} seconds.
${alert.number.failures} exceptions have occurred in policy ${circuit.name}.
The last exception was ${circuit.exception} with path ${circuit.path}.
You can also use the default message to pass information to other systems. For example, the ModSecurity threat reports in API firewalling are stored in the message attribute modsec.error.message in addition to being written to the trace files. You can configure an alert policy to capture the detected threats, and use an Alert filter with a selector for modsec.error.message in the default message to send the threat report to third-party monitoring systems.
Set service context filter
The Set Service Context filter configures service-level monitoring details. For example, you can use the fields on this filter window to configure whether API Gateway stores service usage and service usage per client details. You can also set the name of the service displayed in the web-based API Gateway Manager monitoring tool and the API Gateway Analytics reporting tool.
Name: Enter an appropriate name for the filter to be displayed in a policy.
Service Name: Enter an appropriate name for this service to be displayed in the web-based API Gateway Manager tool.
Monitoring Options: The fields in this group enable you to configure whether API Gateway displays usage metrics data for this web service:
- Enable monitoring: Select this option to enable monitoring for this web service in the Monitoring view in API Gateway Manager, and in API Gateway Analytics.
- Which attribute is used to identify the client:
Enter the message attribute to use to identify authenticated clients. The default is
authentication.subject.id, which stores the identifier of the authenticated user (for example, the user name or user’s X.509 Distinguished Name). - Composite context: This setting enables you to select a service context as a composite context in which multiple service contexts are monitored during the processing of a message. This setting is not selected by default.
- For example, API Gateway receives a message, and sends it to
serviceAfirst, and then toserviceB. Monitoring is performed separately for each service by default. However, you can set a composite service context beforeserviceAandserviceBthat includes both services. This composite service passes if both services complete successfully, and monitoring is also performed on the composite service context.
Send event to Sentinel filter
You can use the Sentinel Event filter to send tracked events to Axway Sentinel. Sentinel uses tracked objects to identify events. Every tracked object contains a unique name, version number, and a list of attributes.
Every tracked event must specify a tracked object, and this tracked object must already be defined in Sentinel. A tracked event can also contain attributes, and the attributes must already be defined as tracked object attributes in Sentinel.
For more details, see the API Gateway Sentinel Interoperability Guide.
Configure the following settings on the Sentinel Event window:
Name: Enter a suitable name for the filter to display in a policy.
Settings tab
Configure the following:
Sentinel Server: Click the browse button to select a Sentinel server connection.
The Tracked object section enables you to specify the tracked object to use in the Sentinel event.
Note
Tracked objects must exist in your Sentinel database before you can start using Sentinel to monitor your applications and track their activities. For more information on defining tracked objects in Sentinel, see the Sentinel Configuration Guide available from Axway Support.Use the following tracked object: Select this option and click the browse button to select a Sentinel tracked object to use. If no tracked objects are already defined, right-click Sentinel Tracked Objects in the dialog and select Add a tracked object.
Enter a Name and a Version for the tracked object. The values entered must correspond to the Public name and Version of the tracked object in Sentinel.
Or use the following from the message: Select this option to retrieve the tracked object name and tracked object version from a message received from an upstream product (for example, B2Bi). If the upstream product has inserted tracking information inside some HTTP headers, you can use selectors to retrieve these from the message.
For example, ${http.headers["X-TRACKEDOBJECT-NAME"]}
retrieves the tracked object name from the HTTP headers, and ${http.headers["X-TRACKEDOBJECT-IDENTITY"]}
retrieves the tracked object version from the HTTP headers.
The Event will contain the following section enables you to specify the tracked object attributes to use in the Sentinel event.
Note
The named event attributes specified in this section must be contained within the tracked object definition in Sentinel.Include Cycle ID:
Select this option to include the cycle ID in the event, and enter a value. For example, enter ${id}
to use the API Gateway transaction ID as the cycle ID. This value is used to populate the CycleId
attribute of the tracked object in Sentinel.
Include policy name in event named: Select this option to include the name of the policy in the event, in an attribute with the specified name. You can use any name for the attribute, as long as the attribute name exists in the tracked object definition in Sentinel.
Include filter name in event named: Select this option to include the name of the filter in the event, in an attribute with the specified name. You can use any name for the attribute, as long as the attribute name exists in the tracked object definition in Sentinel.
You can also add other attributes to be included in the event by populating entries in the table. Click the Add
button to add an attribute. Enter a Name
and a Value
for the attribute. For example, to populate an attribute named UserName
with the authenticated user, you would enter UserName
for the Name
and ${authentication.subject.id}
for the Value.
Send as update: Select this option to send the event as an update.
Tracking tab
Configure the following:
Add Cycle ID in header named: Select this option and enter a value, to include the cycle ID in the HTTP header.
Add Tracked Object name in header named: Select this option and enter a value, to include the tracked object name in the HTTP header.
Add Tracked Object version in header named: Select this option and enter a value, to include the tracked object version in the HTTP header.
Send cycle link event to Sentinel filter
You can use the Sentinel Cycle Link filter to send cycle link events to Axway Sentinel. Sentinel uses cycle links to link processing cycles sequentially. A processing cycle is a group of related tracked events (identified by the same cycle ID).
Every cycle link must specify a parent processing cycle and a child processing cycle. A processing cycle is identified by a cycle ID, and the tracked object name and version are used to identify the tracked events within the processing cycle.
This filter can be used to link related events from different products. For example, if B2Bi and API Gateway are both sending events to the same Sentinel server, each product sends the events with different cycle IDs. You can link the events from B2Bi with the events from API Gateway by sending a cycle link event to the Sentinel server. This links the two cycle IDs in Sentinel.
Configure the following settings on the Sentinel Cycle Link window:
Name : Enter a suitable name for the filter.
Sentinel Server: Click the browse button to select a Sentinel server connection.
The Parent Settings section enables you to specify the cycle ID for the parent processing cycle. You also need to specify the tracked object name and version to identify the relevant tracked events.
Parent Cycle ID:
Enter the cycle ID of the parent processing cycle. This should be the cycle ID of the upstream product (for example, B2Bi). For example, ${http.headers["X-TRACKING-CYCLEID"]}
retrieves the parent cycle ID from the HTTP request headers.
Use the following tracked object: Select this option and click the browse button to select a Sentinel tracked object to use. If no tracked objects are already defined, right-click Sentinel Tracked Objects in the dialog and select Add a tracked object. Enter a Name and a Version for the tracked object. The values entered must correspond to the Public name and Version of the tracked object in Sentinel.
Or use the following from the message: Select this option to retrieve the tracked object name and tracked object version from a message received from an upstream product (for example, B2Bi). If the upstream product has inserted tracking information inside some HTTP headers, you can use selectors to retrieve these from the message.
For example, ${http.headers["X-TRACKEDOBJECT-NAME"]}
retrieves the tracked object name from the HTTP headers, and ${http.headers["X-TRACKEDOBJECT-IDENTITY"]}
retrieves the tracked object version from the HTTP headers.
The Child Settings section enables you to specify the cycle ID for the child processing cycle. You also need to specify the tracked object name and version to identify the relevant tracked events.
Child Cycle ID:
Enter the cycle ID of the child processing cycle. This should be the cycle ID of API Gateway. For example, enter ${id}
to specify the API Gateway transaction ID.
Use the following tracked object: Select this option and click the browse button to select a Sentinel tracked object to use. If no tracked objects are already defined, right-click Sentinel Tracked Objects in the dialog and select Add a tracked object. Enter a Name and a Version for the tracked object. The values entered must correspond to the Public name and Version of the tracked object in Sentinel.
Or use the following from the message: Select this option to retrieve the tracked object name and tracked object version from a message received from an upstream product (for example, B2Bi). If the upstream product has inserted tracking information inside some HTTP headers, you can use selectors to retrieve these from the message.
For example, ${http.headers["X-TRACKEDOBJECT-NAME"]}
retrieves the tracked object name from the HTTP headers, and ${http.headers["X-TRACKEDOBJECT-IDENTITY"]}
retrieves the tracked object version from the HTTP headers.