Amplify Analytics Operational Insights
Operational Insights is one of the components of Amplify Analytics, which also includes Business Insights and Consumer Insights. It helps you to leverage information about your APIs usage to not only manage your technology infrastructure and operations better, but also to generate additional insights for your businesses.
This component works in combination with the analytics stack, Elasticsearch, Logstash, and Kibana (ELK), and allows you to observe millions of requests across different API Gateway instances over a long time frame. It allows you to use Elasticsearch as the data source for the Traffic Monitor, a built-in of API Gateway, allowing for increased scalability and performance.
You can download Operational Insights from the Axway repository.
This section outlines how API Gateway can be integrated to use an existing ELK stack or the basic outline to deploy an ELK stack and connect to it. In the event you do not have an ELK stack, see Elastic Overview documentation for details on configuring and managing an ELK stack.
How it works
This component imports the log files produced by API Gateway instances into an Elasticsearch cluster. After the data has been indexed, it can be used by various clients, such as Kibana, which allows you to visualize the data in dashboards, and the API Gateway Manager Traffic Monitor, which can access the data.
The following are the tooling required to use Operational Insights:
Filebeat
Runs directly on the API Gateways as a Docker container or as a native application. It streams the generated log files to the deployed Logstash instances. The OpenTraffic log, Event log, Trace messages, and Audit logging are streamed. All components, besides Filebeat, can be deployed and configured in a highly available way.
Logstash
Preprocesses the received events before sending them to Elasticsearch. As part of this processing, some of the data (for example, API details) are enriched using APIs provided by API Builder. This allows for enriched information such as policies, custom properties, and so on in Kibana and other applications. This information is cached in Memcached.
Memcached
Used by Logstash to cache information (API details) retrieved from API Builder so that information does not have to be retrieved repeatedly.
API Builder
Performs the following tasks:
- Provides REST APIs for Logstash processing. For this purpose, it mainly uses the API Manager REST API to retrieve the information.
- Provides the same REST API expected by the Traffic Monitor, but based on Elasticsearch. The Admin Node Manager is then redirected to the API builder traffic monitor API.
- Configures Elasticsearch for Operational Insights. This includes index templates, ILM policies, and so on.
Elasticsearch
Ultimately, all information is stored in an Elasticsearch cluster in various indexes, then it is available to Kibana and API Builder. After this data is indexed, it can be used by other clients.
Kibana
Used to visualize the indexed data in dashboards. Operational Insights provides some default dashboards, but you can add custom dashboards to the solution.
Traffic Monitor
The API Gateway Traffic Monitor, is based on a REST API that is provided by the Admin Node Manager. By default, the traffic information is loaded from the OpsDB running on each API Gateway instance. API Builder partially reimplements this REST API, which allows the Traffic Monitor to use data from ElasticSearch instead of the internal OpsDB. This means that you can continue to use the Traffic Monitor, but its underlying implementation is now pointing to Elasticsearch instead of the internal OpsDB hosted by each API Gateway instance. This improves performance dramatically, as Elasticsearch can scale across multiple machines if required.
The link between Elasticsearch and the API Gateway Traffic Monitor is an API Builder project, that is exposing the same Traffic Monitor API, but it is implemented using Elasticsearch instead of the OpsDB. API Builder is available as a ready-to-use Docker image and preconfigured in the provided docker-compose file.
Example architecture
The following image shows an example of Operational Insights component deployed in tandem with a classic API Gateway setup.
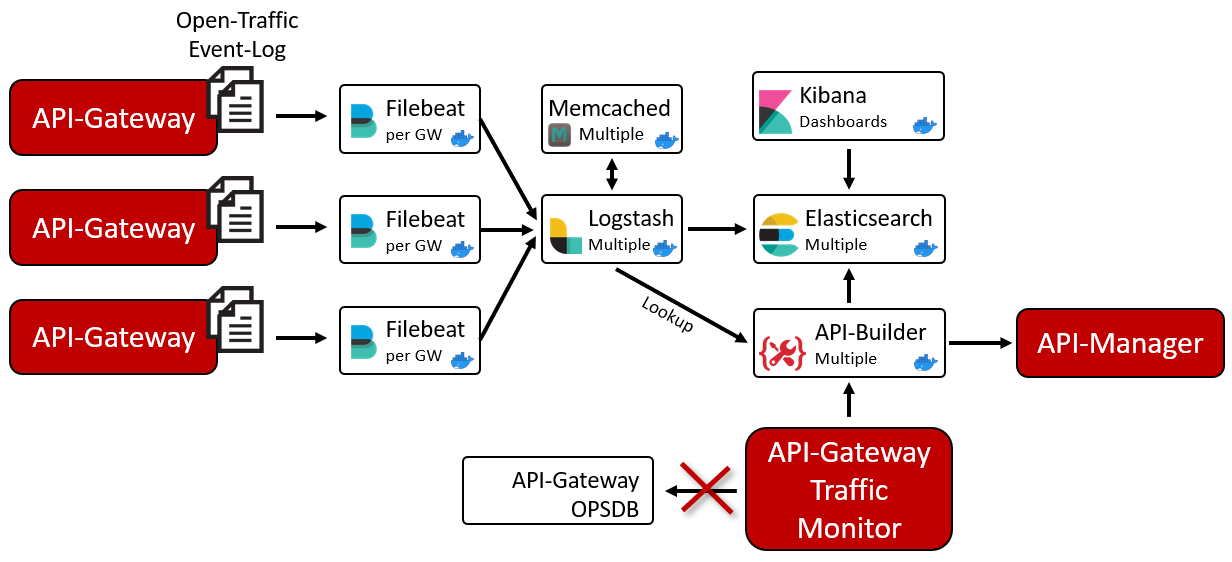
This architecture shows a classic API Gateway setup using two Elasticsearch machines to run Operational Insights. Using a container-orchestration tool such as Helm or Docker Compose, we can scale the number of Elasticsearch machines to improve the throughput, resiliency, and efficiency of Operational Insights and to maintain data persistence.
Key benefits
Operational Insights component provides the following key benefits:
Performance
When having many API Gateway instances with millions of requests, the API Gateway Traffic Monitor observation periods required are quite short. This component solves this issue and make it possible to observe a long time frame and get other benefits by using a standard external datastore, the Elasticsearch.
Visibility
API Manager users can filter on the Traffic Monitor and see only the traffic of their own APIs. This allows API service providers, who have registered their APIs, to monitor and troubleshoot their own traffic without the need of a central team.
Analytics
Deliver standard dashboards that provide analysis capabilities across multiple perspectives. It also allows you to add your own dashboards.
High-level steps to use Operational Insights
The following lists the high-level steps to use this component:
- Ensure that you have read the prerequisites section.
- Configure your system for a single node Elasticsearch cluster.
- Configure Elasticsearch in your API Gateway Manager.
- Configure your system for a production environment.
Monitoring and reporting with Operational Insights
After you integrate this component to your API Gateway Manager, you can avail of better performance to monitor the traffic of your APIs, and you can make use of a large range of Kibana dashboards to help you to understand and analyze your data from different perspectives.
For more information, see Enable monitoring and metrics.
Updates
Operational Insights is under continuous development, and with each release the following artifacts might change:
- Docker Compose files.
- Elasticstack version.
- Logstash pipelines.
- Elasticsearch configuration (for example, Index templates, ILM-Policies, Transformations).
- Filebeat configuration.
- API Builder Docker container version.
- Kibana dashboards.
- Scripts, and so on.
All these tools work tightly together and only work if they are from the same release. Operational Insights component checks if, for example, the index templates have the required version.
It is strongly discouraged to make changes to any file because all files are overwritten with the next release, with exception of the client owned files .env and the config folder. This is the only way to easily update from one version to the next. If you wish to change any file, we recommend you to make this change automatically and repeatably, for example using Ansible. For more information on how to update Operational Insights, see Update Operational Insights.