Configure a basic setup
12 minute read
This section explains the individual components and how they can be deployed and work together. This is a fully functional configuration to get you started as quickly as possible, and which allows you to try out Operational Insights to gain experience and be prepared for the deployment in your production environment.
Note
This configuration is recommended for development environments.After completing the basic setup you will have a single node Elasticsearch instance including multiple Kibana dashboards. You can also import and use the sample Kibana dashboards or create your own visualizations.
At this point, API Gateway Manager is not yet configured, therefore this single instance receives data from 1-to-many API Gateways via Filebeat, Logstash, and API Builder, and is accessible via the Traffic Monitor.
This basic setup uses minimal parameters to run and test Operational Insights on a machine with at least 16 GB of RAM, including the API Management Platform. Therefore, this setup does not suit a production environment without further configuration.
For a production environment, check the parameters mentioned in the env-sample file provided and set them if necessary.
You can deploy Operational Insights using Docker Compose or Helm charts. The following sections cover the common setup for both Helm and Docker Compose options.
Architecture example
The following image shows the overall architecture of the Elasticsearch components running with API Gateway Manager:
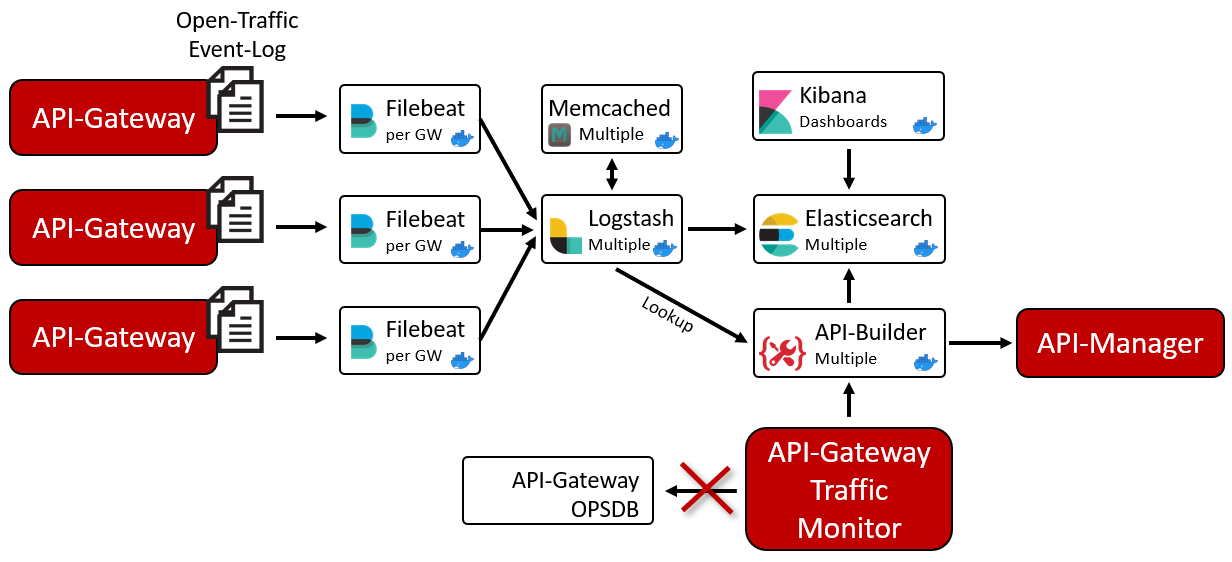
This architecture makes it possible to collect data from API Gateway instances into a centralized Elasticsearch instance to have the data available with the best possible performance, independent of the network performance.
It also helps with data persistency when running API Gateway in a Docker environment where containers are started and stopped, as it avoids the loss of data when an API Gateway container is stopped.
Enable Open Traffic Event Log
You must enable Open Traffic Event Log for your API Gateway instances to allow your log files to be created by default at apigateway/logs/opentraffic. This location is required for when configuring Filebeat later.
To avoid data loss from your API Gateway instance, it is strongly recommended to increase the disk space for the Open Traffic logs from 1 GB to at least 8 GB, particularly if you have a lot of traffic in your API Gateway instance. For example, if Filebeat and Logstash are not running to process events for any period of time, data might be lost because of logging and data policies.
Install Kibana dashboards
To install Kibana dashboards, use the Kibana Menu Stack Management > Saved Objects > Import saved objects and select the following file from the release package, kibana/dashboards/7/*.ndjson.
On the Import options window, select Automatically overwrite conflicts. This is the default setting, and you must always select it regardless of whether you are installing the dashboards for the first time or after an update.
You can create customized visualizations and dashboards, but do not change the ones that come by default because they will be overwritten with the next update. Customized visualizations and dashboards are not changed by the import action.
Setup Admin Node Manager
Configure Admin Node Manager (ANM) to render log data provided by Elasticsearch instead of the individual API Gateway instances. The ANM API listens to port 8090 for administrative traffic by default, and it is responsible for serving the Traffic Monitor.
To configure the node manager to render log data from Elasticsearch, follow these steps:
-
Open the node manager configuration in Policy Studio. For more information, see Authentication and RBAC with Active Directory.
-
Import the provided policy fragment (
nodemanager/policy-use-elasticsearch-api-7.7.0.xml) from the release package you have downloaded. This imports the policy, Use Elasticsearch API. -
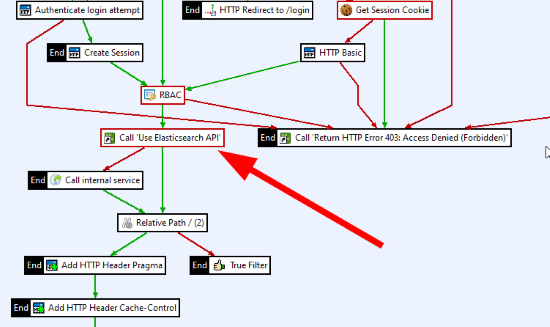
Update the Protect Management Interfaces policy by inserting the Use Elasticsearch API policy as a callback policy (see filter, Shortcut filter) into the main policy, and wire it like shown in the following image.
-
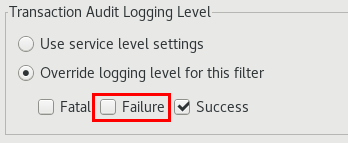
Disable the audit log for Failure transactions to avoid unnecessary log messages in the node manager trace file.
-
Configure your ANM with your Certificate Authority (CA) in the form of a
.p12file to ensure the ANM can communicate with API Builder (See custom certificates for details on how to generate the certificate-key pair). Import the CA into Policy Studio as follows:- Navigate to Environment Configuration > Certificates and Keys > Certificates.
- Click Create/Import > Import Certficate + Key, then search and select your
CA.p12file. - Click Use Subject for the Alias Name, then click OK.
-
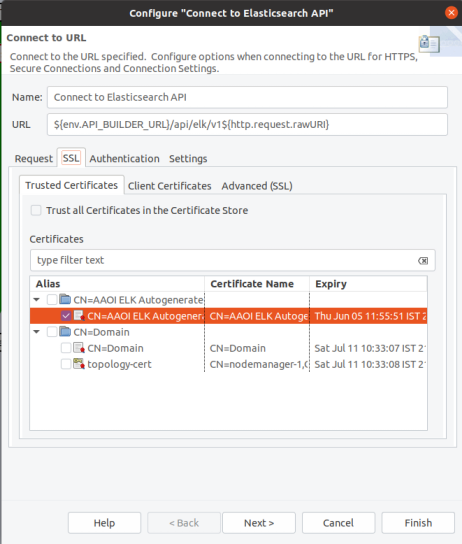
Navigate to the Use Elasticsearch API policy to configure the request to the Elasticsearch API to use the imported CA:
-
Double click Connect to Elasticsearch API and navigate to the SSL tab.
-
In the Trusted Certicates tab, select the certificate that you have imported.
-
Click Finish.
-
-
If running API Builder locally on ANM, open the
<apigateway-install-dir>/apigateway/conf/envSettings.propsfile and add theenv.API_BUILDER_URLenvironment variable to point towards the API Builder URL. For example,env.API_BUILDER_URL=https://localhost:8443. -
If you are using multiple regions, you must configure the appropriate region to restrict the data of node manager to the correct regional data, for example,
env.REGION=US. -
Copy the new configuration from the Policy Studio project folder (path on Linux,
/home/<user>/apiprojects/<project-name>) back to the ANM folder (<install-dir>/apigateway/conf/fed). -
Restart the Admin Node Manager.
Note
An alternative to using the provided policy fragment,nodemanager/policy-use-elasticsearch-api-7.7.0.xml, is to manually configure the Admin Node Manager Policy.
Configure Admin Node Manager per region
If you use Operational Insights with multiple regions and different domains, all events and documents are stored in one single Elasticsearch. Therefore, you also need to tell the Admin Node Manager (ANM) in each region, which data (indices) to use. If you fail to do that, the ANM will show the entire traffic from all regions, which might not be desired.
To indicate to the node manager which data to use, store the appropriate region, which is also specified in the Filebeats for the API gateways, in the conf/envSettings.props file and restart the node manager. For example:
env.REGION=US
By doing this, ANM will only select data from these regional indexes. To learn more about the region parameter and multiple API Managers, see Multiple API Managers.
Traffic Monitor view for API Manager users
In larger companies, hundreds of API service providers use API Manager to register their own services and APIs. While the service providers require access to the Traffic Monitor to monitor their own APIs independently, during registration, the corresponding APIs are assigned to API Manager organizations, which logically split them up. However, the standard traffic monitor does not restrict the view for a user based on the organization of an API.
Operational Insights solves this problem by storing the API transactions in Elasticsearch with the appropriate organization. The API organization is used when reading the traffic data from Elasticsearch, based on the following table.
| API Gateway Manager | API Manager | Restriction | Comment |
|---|---|---|---|
| Administrator | N/A | Unrestricted access | A Gateway Manager user is considered as an Admin when they own the permission, adminusers_modify. |
| Operator | API Admin | All APIs having a service context | By default, each API processed by the API Manager has a Service context. Pure API Gateway APIs, for example, . /healthcheck, will not be visible. |
| Operator | Org Admin | APIs of its own organization | This user only sees the APIs that belong to the same organization as himself. |
| Operator | User | APIs of its own organization | The same rules apply as for the Org Admin. |
Setup API Manager user in API Gateway Manager
To restrict access to the API Gateway Traffic Monitor based on the API Manager user, the user must be configured in the API Gateway Manager with the same login name as in the API Manager. By default, all API Gateway Traffic Monitor users have unrestricted access if one of their roles includes the adminusers_modify permission. All other users have a restricted view of the API traffic.
To set up or change the user authorization, you must configure it in the UNRESTRICTED_PERMISSIONS parameter, located in your .env file.
Setup with Helm
To set up Operational Insights with Helm, see setup Operational insights in your production environment.
Basic setup with Docker Compose
The following sections cover the configuration specific to using Docker Compose.
- Pull down the latest APIBuilder4Elastic image from repository.axway.com.
- Download the corresponding
.tar.gzconfiguration files from the Axway repository. - Configure the image to be used in your configuration files by changing the
imageparameter inside of thedocker-compose.yaml.
To simplify updates, it is recommended to create a symlink folder and rename the provided env-sample file to .env in each machine as follows:
ln -s axway-apim-elk-v1.0.0 axway-apim-elk
cd axway-apim-elk-v1.0.0
cp env-sample .env
You should store your .env file as a central configuration file in a version management system.
Custom certificates
If an existing Elasticsearch cluster is already deployed, provide the required CA to allow certificate validation. Otherwise, a certificate must be created for each component. The script config/certificates/quickgen_certs_and_keys.sh creates the corresponding certificates and keys in the config/certificates folder. Afterwards, these certificates must be configured in the .env file:
API_BUILDER_SSL_KEY=config/certificates/apibuilder4elastic.key
API_BUILDER_SSL_CERT=config/certificates/apibuilder4elastic.crt
API_BUILDER_SSL_KEY_PASSWORD=<YOUR_SSL_KEY_PASSWORD>
ELASTICSEARCH_CA=config/certificates/ca.crt
ELASTICSEARCH_KEY=config/certificates/elasticsearch1.key
ELASTICSEARCH_CRT=config/certificates/elasticsearch1.crt
KIBANA_KEY=config/certificates/kibana.key
KIBANA_CRT=config/certificates/kibana.crt
Note
Thequickgen_certs_and_keys.sh script is meant for a quick setup and development environments only, and is not fit for A production environment.
Setup Elasticsearch
If you are using an existing Elasticsearch cluster, you can skip this section and jump to the Logstash, Memcached and APIBuilder4Elastic section.
To setup Elasticsearch, open your .env file and configure the ELASTICSEARCH_HOSTS parameter in a single Elasticsearch node. You can start with a single node and add more nodes later. This parameter is used by all Elasticsearch clients (Logstash, API Builder, Filebeat) to establish communication. If you are using an external Elasticsearch cluster, specify your nodes instead. Note that the hostnames must be resolvable within the Docker containers.
You must change the following parameters before starting the cluster:
ELASTICSEARCH_HOSTS=https://my-elasticsearch-host.com:9200
ELASTICSEARCH_CLUSTERNAME=axway-apim-elasticsearch-prod
ES_JAVA_OPTS="-Xms8g -Xmx8g"
Run the following command to initialize a new Elasticsearch cluster, which runs the appropriate bootstrapping. Later, you can add more nodes to this single node cluster. Do not use the init extension when restarting the node:
docker-compose --env-file .env -f elasticsearch/docker-compose.es01.yml -f elasticsearch/docker-compose.es01init.yml up -d
Wait until the cluster has started, then call the following URL:
curl -k GET https://my-elasticsearch-host.com:9200
Result:
{
  "name" : "elasticsearch1",
  "cluster_name" : "axway-apim-elasticsearch",
  "cluster_uuid" : "nCFt9WhpQr6JSOVY_h48gg",
  "version" : {
    "number" : "7.16.1",
    "build_flavor" : "default",
    "build_type" : "docker",
    "build_hash" : "d34da0ea4a966c4e49417f2da2f244e3e97b4e6e",
    "build_date" : "2020-09-23T00:45:33.626720Z",
    "build_snapshot" : false,
    "lucene_version" : "8.6.2",
    "minimum_wire_compatibility_version" : "6.8.0",
    "minimum_index_compatibility_version" : "6.0.0-beta1"
  },
  "tagline" : "You Know, for Search"
}
At this point, you can add the cluster UUID (ELASTICSEARCH_CLUSTER_UUID) to the .env file to get the single-node Elasticsearch cluster up and running.
Setup Kibana
If you are using an existing Elasticsearch cluster, you can skip this section and jump to Logstash, Memcached and APIBuilder4Elastic section.
All required parameters for Kibana are set by default in your .env file. Start Kibana with the following command:
docker-compose --env-file .env -f kibana/docker-compose.kibana.yml up -d
If running Kibana locally, access it by way of the following link:
https://localhost:5601
If Kibana does not start (it might take 3-4 minutes) or it does not load correctly, run the docker logs kibana command to open the log and examine the running container.
Setup Logstash, Memcached, and APIBuilder4Elastic
It is recommended to deploy Logstash, Memcached, and APIBuilder4Elastic components on a single machine first, so they are in a common Docker Compose file and share the same network. Furthermore, low latency between these components is beneficial. The default values for Logstash, Memcached, and API Builder in your .env file are set up with the assumption that these components are running on the same machine.
Use the following parameter to specify where the Admin Node Manager or the API Manager can be found:
ADMIN_NODE_MANAGER=https://my-admin-node-manager:8090
If not using the default API Manager admin user and password, use the following parameters to specify the API Manager admin user details:
API_MANAGER_USERNAME=elkAdmin
API_MANAGER_PASSWORD=elastic
If you are using an existing Elasticsearch cluster and have therefore skipped sections Setup Elasticsearch and Setup Kibana, you must now configure the Elasticsearch hosts, any necessary users, and the Elasticsearch server certificates as follows:
ELASTICSEARCH_HOSTS=https://my-existing-elasticsearch-host1.com:9200, https://my-existing-elasticsearch-host2.com:9200, https://my-existing-elasticsearch-host3.com:9200
Use the the main Docker Compose file to start all three components:
docker-compose up -d
Check that the docker containers for Logstash, API Builder, and Memached are running.
[ec2-user@ip-172-31-61-59 axway-apim-elk-v1.0.0]$ docker ps
Result:
CONTAINER ID        IMAGE                                       COMMAND                  CREATED             STATUS                 PORTS                              NAMES
d1fcd2eeab4e        docker.elastic.co/logstash/logstash:7.12.2  "/usr/share/logstash…"   4 hours ago         Up 4 hours             0.0.0.0:5044->5044/tcp, 9600/tcp   logstash
4ce446cafda1        apibuilder4elastic:v1.0.0                   "docker-entrypoint.s…"   4 hours ago         Up 4 hours (healthy)   0.0.0.0:8443->8443/tcp             apibuilder4elastic
d672f2983c86        memcached:1.6.6-alpine                      "docker-entrypoint.s…"   4 hours ago         Up 4 hours             11211/tcp                          memcached
It might take some time (2-3 minutes) until Logstash is finally started. You should expect to see the following when examining the Logstash logs:
docker logs logstash
Pipelines running {:count=>6, :running_pipelines=>[:".monitoring-logstash", :BeatsInput, :Events, :DomainAudit, :TraceMessages, :OpenTraffic], :non_running_pipelines=>[]}
Successfully started Logstash API endpoint {:port=>9600}
- The Logstash API endpoint (
9600) is not exposed outside the Docker container. - Logstash is configured not to create indexes or index templates in Elasticsearch. These will be handled later on by API Builder when the first events are received. This is because they might need to be created accordingly to the region specified in the configuration file.
Setup Filebeat
Filebeat must be configured and started to begin reading and sending your gateway’s logging data. You can start Filebeat as a Docker container using the Docker Compose files and mount the corresponding directories into the container. Alternatively, you can install Filebeat natively on the API gateway and configure it accordingly. For that, you must use the filebeat/filebeat.yml file as a base configuration file. This file contains instructions that control the logstash pipelines.
Add the following to your configuration. At this point you can already configure the Filebeat instances with a name and region if you like. The following instructions assume that you set up Filebeat based on filebeat/docker-compose.filebeat.yml.
APIGATEWAY_LOGS_FOLDER=/opt/Axway/APIM/apigateway/logs/opentraffic
APIGATEWAY_TRACES_FOLDER=/opt/Axway/APIM/apigateway/groups/group-2/instance-1/trace
APIGATEWAY_EVENTS_FOLDER=/home/localuser/Axway-x.y.z/apigateway/events
APIGATEWAY_AUDITLOGS_FOLDER=/home/localuser/Axway-x.y.z/apigateway/logs
GATEWAY_NAME=API-Gateway 3
GATEWAY_REGION=US
Audit logs are optional. If you do not wish them indexed, just point them to an invalid folder. You can find more information about each parameter in the env-sample.
To start the Filebeat container, run:
docker compose --env-file .env -f filebeat/docker-compose.filebeat.yml up -d
Use docker logs filebeat to check the health of the container and that no errors are displayed. You can examine the indexes in Kibana (Menu > Management > Stack Management > Index Management) to check whether the indexes are filled with data. If you encounter any issues, see Troubleshooting.
Where to go next
After you have set up Operational Insights in a single node Elasticsearch scenario, you can proceed to set up in your production environment.