Configure a production setup for Helm
8 minute read
This section covers the configuration specific for deploying Axway API Management for the Elastic solution on a Kubernetes or OpenShift cluster using Helm. The provided Helm chart is extremely flexible and configurable. You can decide which components to deploy, use your own labels, annotations, secrets, and volumes to customize the deployment to your needs.
Note
To access sample files referred throughout this section for user customizations, follow the instructions on the Docker Compose section to download the release package.Before you start
- Ensure that you have all prerequisites in place.
Create your configuration file
The first step to setup Operational Insights in your production environment using Helm, is to create your own myvalues.yaml based on the standard values.yaml chart and to configure the required parameters. All parameters are explained in detail in the values.yaml chart.
The following example represents the most simple myvalues.yaml configuration, assuming the API Management Platform and Filebeat are running externally to the Kubernetes cluster as indicated in the Helm architecture diagram.
apibuilder4elastic:
  image: "docker.repository.axway.com/apigateway-docker-prod/<VERSION_TAG>/apibuilder4elastic:<VERSION_TAG>"
  anmUrl: "https://my-admin-node-manager:8090"
  secrets:
    apimgrUsername: "apiadmin"
    apimgrPassword: "changeme"
# Enable if you would like to deploy a new Elasticsearch cluster for Operational Insights
elasticsearch:
  enabled: true
  volumeClaimTemplate:
    accessModes: [ "ReadWriteOnce" ]
    resources:
      requests:
        storage: 1Gi
# Enable if you would like to deploy Kibana for Operational Insights
kibana:
  enabled: true
Note
Theimage parameter specified in your myvalues.yaml file must be configured to point to a specific docker release available from repository.axway.com.
Define Elasticsearch persistent volumes
Elasticsearch requires persistent volumes to function correctly. This can be configured through your own myvalues.yaml but will be dependent on the environment and platform you are deploying. You can use the storage class provided by the platform or create your own.
After a storage class is available, you must define it in the appropriate section of your myvalues.ymal. For example,
elasticsearch:
  enabled: true
  volumeClaimTemplate:
    accessModes: [ "ReadWriteOnce" ]
    resources:
      requests:
        storage: 1Gi
    storageClassName: example-nfs-share
Install the Helm chart
After your Elasticsearch volumes are created and your myvalues.yaml file is configured, you can start the installation as follows. The Helm release name, axway-elk, is mandatory. For more information, see FAQ - Why is the Helm release name axway-elk.
helm install -n apim-elk -f myvalues.yaml axway-elk <repository.axway.com>
Note
Refer torepository.axway.com for the most recent version of the Helm chart and the corresponding configuration files.
To check the status of the deployment, pods, services, and son on, run the following commands:
# Check the installed release
helm list -n apim-elk
NAME            NAMESPACE       REVISION        UPDATED                                 STATUS          CHART                           APP VERSION
axway-elk       apim-elk        1               2021-05-03 14:22:08.9325287 +0200 CEST  deployed        apim4elastic-4.2.0              4.2.0

# Check the pods with Elasticsearch and Kibana enabled
kubectl get pods -n apim-elk
NAME                                                         READY   STATUS    RESTARTS   AGE
axway-elk-apim4elastic-apibuilder4elastic-65b5d56d77-5hv9z   1/1     Running   1          7h2m
axway-elk-apim4elastic-elasticsearch-0                       1/1     Running   0          7h2m
axway-elk-apim4elastic-elasticsearch-1                       1/1     Running   0          7h2m
axway-elk-apim4elastic-kibana-7c6d4b675f-dnxj7               1/1     Running   0          7h2m
axway-elk-apim4elastic-logstash-0                            1/1     Running   0          7h2m
axway-elk-apim4elastic-memcached-56b7447d9-25xwb             1/1     Running   0          7h2m

# Check deployed services
kubectl -n apim-elk get service
NAME                                                TYPE        CLUSTER-IP      EXTERNAL-IP   PORT(S)             AGE
axway-elk-apim4elastic-apibuilder4elastic           ClusterIP   None            <none>        8443/TCP            7h7m
axway-elk-apim4elastic-elasticsearch                ClusterIP   10.100.85.132   <none>        9200/TCP,9300/TCP   7h7m
axway-elk-apim4elastic-elasticsearch-headless       ClusterIP   None            <none>        9200/TCP,9300/TCP   7h4m
axway-elk-apim4elastic-kibana                       ClusterIP   10.105.84.214   <none>        5601/TCP            7h7m
axway-elk-apim4elastic-logstash                     NodePort    10.103.53.111   <none>        5044:32001/TCP      7h7m
axway-elk-apim4elastic-logstash-headless            ClusterIP   None            <none>        9600/TCP            7h7m
axway-elk-apim4elastic-memcached                    ClusterIP   10.108.48.131   <none>        11211/TCP           7h7m

# Describe a certain POD
kubectl -n apim-elk describe pod axway-elk-apim4elastic-elasticsearch-0

# Get the logs for a POD
kubectl -n apim-elk logs axway-elk-apim4elastic-apibuilder4elastic-65b5d56d77-5hv9z
If all configuration has worked and your Ingress configuration is running, you can access the different components on the following host names:
https://kibana.apim4elastic.localhttps://apibuilder.apim4elastic.localhttps://elasticsearch.apim4elastic.local
This example assumes that Ingress is configured and the DNS resolution for apim4elastic.local points to your cluster IP.
At this point, it is still assumed that the API Management platform is running externally. Therefore, the next step is to connect one or more Filebeats to Logstash running in Kubernetes.
Configure Logstash and Filebeat
The communication between Filebeat and Logstash is a persistent TCP connection. This means that once the connection has been established, it will continue to be used for the best possible throughput. If you specify multiple Logstash instances in your Filebeat configuration, then Filebeat will establish multiple persistent connections and uses all of the them for load balancing and failover.
In the case of Kubernetes or OpenShift, multiple Logstash instances are running behind a Kubernetes service, which acts like a load balancer. However, because of the persistent connection, the load balancer and the service cannot really distribute the load. Therefore, for high volumes, the best option is to let Filebeat perform the load balancing.
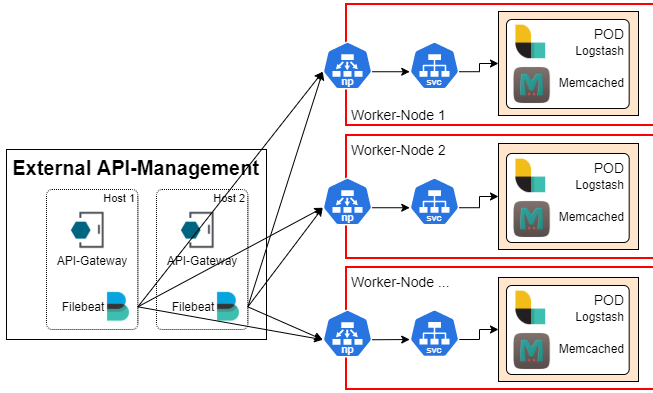
Configure NodePort service
By default, the Helm chart deploys a NodePort service for Logstash, then it becomes available on the configured port 32001 on all nodes of the cluster. You can setup the corresponding nodes as Logstash hosts in your Filebeat configuration with Load balancing enabled, and Filebeat will distribute the traffic across the available Logstashes by establishing multiple persistent connections.
The following diagram illustrates the approach:
The following is an example setup of the above configuration:
# The service exposing Logstash as a NodePort on 32001
kubectl -n apim-elk get services axway-elk-apim4elastic-logstash -o wide
NAME                              TYPE       CLUSTER-IP      EXTERNAL-IP   PORT(S)          AGE   SELECTOR
axway-elk-apim4elastic-logstash   NodePort   10.110.89.215   <none>        5044:32001/TCP   85m   app=axway-elk-apim4elastic-logstash,chart=logstash,release=axway-elk

# The given NodePort (default 32001) is exposed on all Worker-Nodes:
kubectl get nodes -o wide
NAME                            STATUS   ROLES                  AGE   VERSION   INTERNAL-IP     EXTERNAL-IP   OS-IMAGE         KERNEL-VERSION                  CONTAINER-RUNTIME
ip-172-31-51-209.ec2.internal   Ready    <none>                 23h   v1.21.0   172.31.51.209   <none>        Amazon Linux 2   4.14.209-160.339.amzn2.x86_64   docker://19.3.13
ip-172-31-53-214.ec2.internal   Ready    <none>                 23h   v1.21.0   172.31.53.214   <none>        Amazon Linux 2   4.14.193-149.317.amzn2.x86_64   docker://19.3.6
ip-172-31-54-120.ec2.internal   Ready    <none>                 23h   v1.21.0   172.31.54.120   <none>        Amazon Linux 2   4.14.209-160.339.amzn2.x86_64   docker://19.3.13
ip-172-31-61-143.ec2.internal   Ready    control-plane,master   23h   v1.21.0   172.31.61.143   <none>        Amazon Linux 2   4.14.181-142.260.amzn2.x86_64   docker://19.3.6
The following is an example of the configuration for the Filebeat Logstash output:
output.logstash:
  # Based on our tests, the more WorkerNodes you add, the more likely the traffic
  # is evenly distributed
  hosts: ["172.31.51.209:32001", "172.31.53.214:32001", "172.31.54.120:32001"]
  # Or as part of the .env:
  # LOGSTASH_HOSTS=172.31.51.209:32001,172.31.53.214:32001,172.31.54.120:32001
  worker: 2
  bulk_max_size: 3072
  loadbalance: true
  # Required for the NodePort service approach to give Filebeat a chance to recognize
  # and use additional Logstash instances that have been provisioned.
  # 5m was determined to be the best value for the highest possible throughput.
  # Values lower than 5 minutes may cause an error in Filebeat described here:
  # https://www.elastic.co/guide/en/beats/filebeat/current/publishing-ls-fails-connection-reset-by-peer.html
  ttl: 2m
  # Required to make TTL working
  pipelining: 0
The NodePort service without any load balancer in between is the recommended approach for the best possible throughput. This has been tested with up to 1.000 TPS using four Logstash instances and a five-node-Elasticsearch cluster.
Utilize a load balancer
You can also use a load balancer to have a single entry point. You can reconfigure the Logstash service from a NodePort to a LoadBalancer and use, for instance, your public cloud load balancer from AWS, GCP, and so on. In this scenario, you must ensure that Filebeat is set with an appropriate TTL to improve the load and make it better distributed between the available Logstash instances. However, it is still random to which Logstash instances connections are established. So, you might see situations where some Logstash instances are on idle status while others are under heavy load.
For example:
output.logstash:
  # Or as part of the .env:
  # LOGSTASH_HOSTS=172.31.51.209:32001,172.31.53.214:32001,172.31.54.120:32001
  hosts: ["logstash.on.load-balancer:5044"]
  worker: 2
  bulk_max_size: 3072
  # This parameter has no effect as there is only one Logstash host configured
  loadbalance: true
  # The following two parameters drop and re-establish the connection to Logstash every 5 minutes
  # With that, you give the Service/LoadBalancer from time to time the chance to distribute the traffic.
  # But even with that, it might be the case that call traffic goes to one Logstash instance.
  # Do not set the TTL to less than 1 minute as it would increase the connection management overhead
  ttl: 2m
  # Required to make TTL working
  pipelining: 0
Enable user authentication
To enable the user authentication for a newly created Elasticsearch cluster, you must generate passwords for the default Elasticsearch users and store them in your myvalues.yaml file or in your own secrets.
Run the following command to generate the passwords for the default users.
kubectl -n apim-elk exec axway-elk-apim4elastic-elasticsearch-0 -- bin/elasticsearch-setup-passwords auto --batch --url https://localhost:9200
The following example shows how to setup the Elasticsearch users in your myvalues.yaml and disable anonymous access.
apibuilder4elastic:
  secrets:
    elasticsearchUsername: "elastic"
    elasticsearchPassword: "XXXXXXXXXXXXXXXXXXXX"
logstash:
  logstashSecrets:
    # Used to send stack monitoring information
    logstashSystemUsername: "logstash_system"
    logstashSystemPassword: "XXXXXXXXXXXXXXXXXXXX"
    # Used to send events
    logstashUsername: "elastic"
    logstashPassword: "XXXXXXXXXXXXXXXXXXXX"
kibana:
  kibanaSecrets:
    username: "kibana_system"
    password: "XXXXXXXXXXXXXXXXXXXX"
filebeat:
  filebeatSecrets:
    beatsSystemUsername: "beats_system"
    beatsSystemPassword: "XXXXXXXXXXXXXXXXXXXX"
  # Required for the internal stack monitoring to work with Filebeat
  elasticsearchClusterUUID: "YOUR-CLUSTER-UUID-ID"
# Required for the Elasticsearch readiness check after users have been generated
elasticsearch:
  elasticsearchSecrets:
    elasticUsername: "elastic"
    elasticPassword: "XXXXXXXXXXXXXXXXXXXX"
  anonymous:
    enabled: false
Customize your Helm chart
You can use your own secrets, ConfigMaps, and son on to customize Operational Insights. We recommend that you create your own Helm chart that contains all the necessary resources, then link your custom resources in your myvalues.yaml to deploy Operational Insights.
You can customize your Helm chart as follows:
helm create axway-elk-setup
cd axway-elk-setup
Use a secret for API Manager username and password
The following example shows how you can create a secret that keeps the API Manager username and password and use it with API Builder. The same procedure applies for all confidential information. For more details, see the values.yaml file.
-
Create a secret:
kubectl create secret generic api-builder-secrets --from-literal=API_MANAGER_PASSWORD=changeme --from-literal=API_MANAGER_USERNAME=apiadmin -n apim-elk -
Reference the secret. Update your
myvalues.yamlto reference the created secret. Additionally, you must declare the defaultConfigMapif you do not want to manage thatConfigMapyourself.apibuilder4elastic: envFrom: - configMapRef: name: axway-elk-apim4elastic-apibuilder4elastic-config - secretRef: name: api-builder-secrets # Optionally, disable the secrets driven by the values.yaml secrets: enabled: false -
Install or upgrade APIM4Elastic:
helm upgrade -n apim-elk -f myvalues.yaml axway-elk <repository.axway.com>Note
Refer torepository.axway.comfor the most recent version of the Helm chart.
As a result of this section, you have set up your myvalues.yaml Helm chart to run Operational Insights in a single instance in a production environment.