Configure open logging
6 minute read
When open logging is enabled, API Gateway generates open traffic event logs containing traffic event data in a JSON format that is easily consumed by external systems.
This section describes the supported open logging flows, and explains how you can use open logging to forward log and trace information to an external system. It also describes the open traffic event log file format and configuration options.
Note
Events are logged after a transaction is processed by API Gateway. A catastrophic failure might result in one or more processed transactions not being written to the log.Introduction to transactions and legs
This section explains inbound and outbound transactions and legs in the context of how a typical message transaction flows from a client to a back-end via an API Gateway.
The following diagram shows a typical transaction flow through an API Gateway.
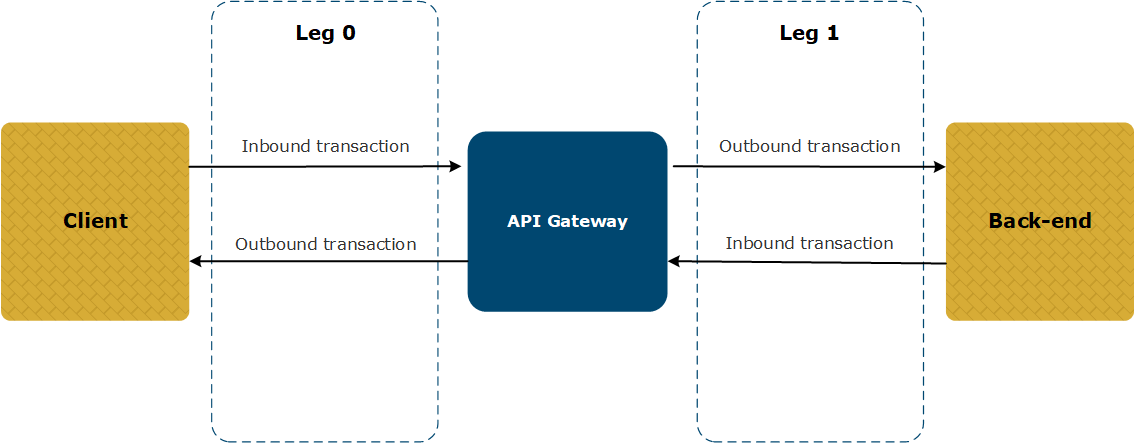
- An inbound transaction is one coming from a client or a back-end that is incoming to the API Gateway (received by the API Gateway).
- An outbound transaction is one that is outgoing from the API Gateway to a back-end or a client (sent by the API Gateway).
- Leg 0 is always the interaction between the client and the API Gateway.
- Leg 1 (and subsequent legs) are the interactions between API Gateway and the back-ends.
- The duration of leg 0 is the overall duration of the entire transaction (as seen by the client).
- The duration of each subsequent leg is the back-end transaction duration.
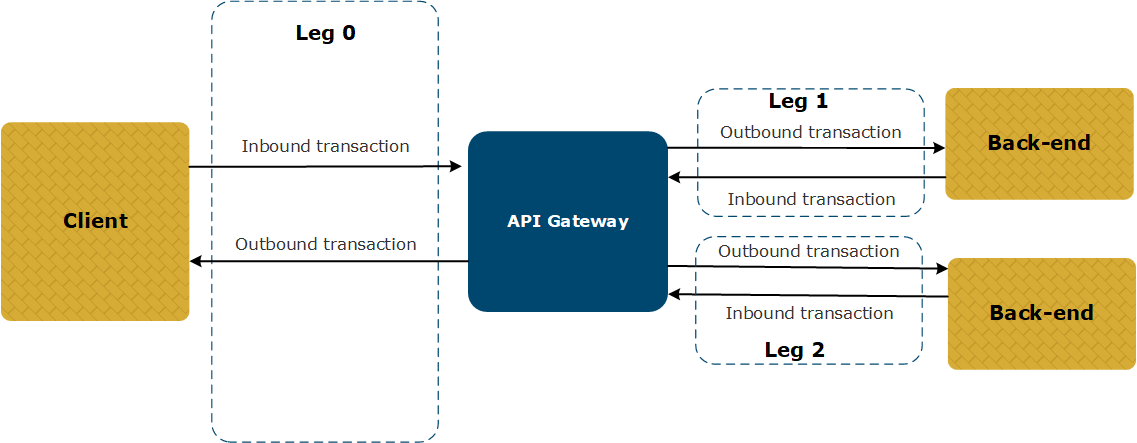
The following diagram shows a typical transaction flow when multiple back-ends are involved.
API Gateway logging flows
Some typical logging flows are shown in the following diagram:
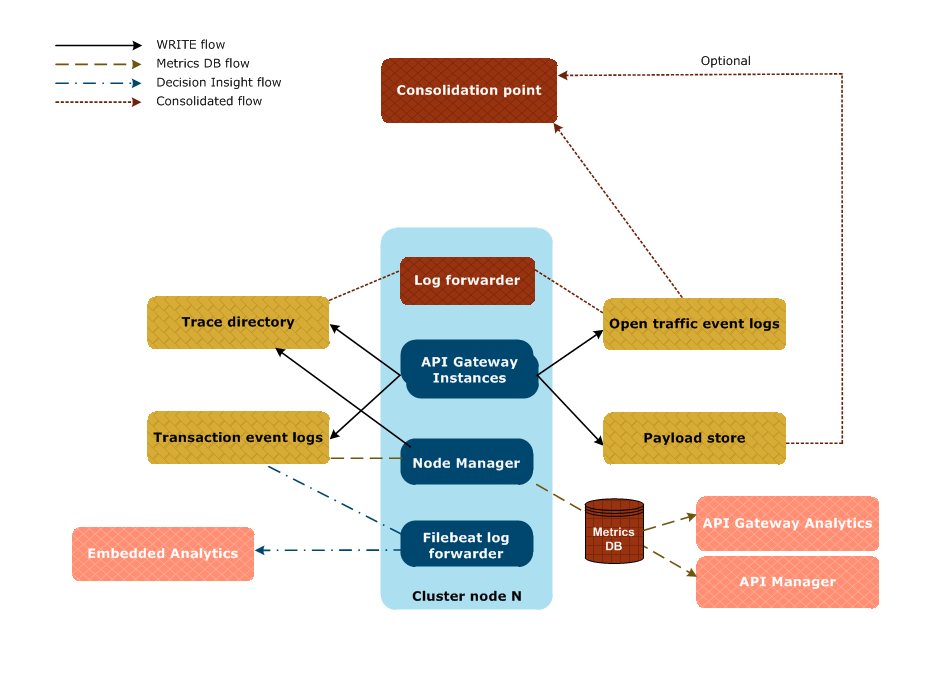
Log and trace information stored by API Gateway
Each gateway instance writes:
- transaction event information to the transaction event log
- traffic monitoring information to an OpsDB database (not shown in above diagram)
- trace information to trace files
- transaction event and traffic monitoring information to the open traffic event log
- transaction payload information to a payload store (if payload storage is enabled)
The Node Manager also writes trace information to trace files.
Metrics database flow
The Node Manager aggregates the transaction event logs from the gateway instances in a domain and writes them to a metrics database for monitoring in API Gateway Analytics, API Manager, or in third-party tools. For more details, see Configure API Gateway for a metrics database.
Decision Insight flow
A Filebeat log forwarder is used to forward the transaction event logs from the API Gateway instances to Axway Decision Insight for use by Embedded Analytics.
Filebeat is included in your API Gateway installation in the following directory:
INSTALL_DIR/apigateway/tools/
For more information on configuring Filebeat, see the Embedded Analytics for Amplify API Management documentation.
Note
In a future release, Embedded Analytics will use the open traffic event log.Consolidated flow for third-party system
To consolidate the flow of transaction event data, traces, and system metrics stored by API Gateway, you can perform the following steps:
- Configure open traffic event logging as detailed in Configure open traffic event logging.
- Set up a log forwarder to read the trace files and the open traffic event log files from API Gateway and forward them to a consolidation point for use by a third-party observability system.
Open traffic event log formats
Open traffic event log files are located in the logs directory of your API Gateway installation by default. For example:
INSTALL_DIR/apigateway/logs/group-2_instance-1_traffic.log
In a distributed system with multiple API Gateway instances running, the data is written to separate open traffic event log files for each gateway instance.
The open traffic event log combines the data from:
- Transaction event log – This log contains a summary of transactions in JSON format. For more details on the transaction event log, see Transaction event log settings.
- Traffic monitor – This log contains detailed traffic monitoring information including transaction payloads, policy paths, and so on. This data is stored in a proprietary OpsDB format. For more details on traffic monitor, see Traffic monitoring settings.
The combined data is written to an open traffic event log file in JSON format. The JSON schema is described in Open logging schema and is available in your installation at INSTALL_DIR/apigateway/system/schemas/logging/openLogging.json.
Transaction payloads are stored separately (if payload storage is enabled) and are linked to the open traffic event log files by ID. Payload files are named as follows:
<transaction ID>-<Leg>-<sent|received>
For more information on transaction and legs, see Introduction to transactions and legs in API Gateway.
The following are some example payload file names:
48e59a594900238c49037036-0-received
48e59a594900238c49037036-1-sent
48e59a594900238c49037036-1-received
48e59a594900238c49037036-0-sent
Payload files are only generated by open logging if the message includes a payload. For example, for a POST request in a 2-legged flow (single call-out to a back-end), leg 0 is the interaction between the client and the gateway and leg 1 is the interaction between the gateway and the back-end, giving you:
<transaction id>-0-received: incoming request body from client (leg 0)<transaction id>-1-sent: outgoing request body to back-end (leg 1)<transaction id>-1-received: incoming response body from back-end (leg 1)<transaction id>-0-sent: outgoing response body to client (leg 0)
However, for a GET request with no body in the same situation, only the following payload files are generated:
<transaction id>-1-received: incoming response body from back-end (leg 1)<transaction id>-0-sent: outgoing response body to client (leg 0)
Configure open traffic event logging
Open traffic event logging is disabled by default. To enable it, perform the following steps:
- In the Policy Studio tree, select Server Settings > Logging > Open Traffic Event Log.
- Select Enable Open Traffic Event Log.
- Specify the required settings (for example, directory, max disk space, payload storage, and so on).
- When finished, click Save at the bottom right.
- Click Deploy in the toolbar to deploy your settings to the API Gateway.
For details on configuring all the available options, see Open traffic event log settings.
Environment variables
These variables override the open logging settings configured in Policy Studio, which enables the logging behavior to be defined at runtime.
APIGW_LOG_OPENTRAFFIC_OUTPUT=[none | file | stdout]
- none = Do not log open traffic data
- file = Log open traffic data to a file
- stdout = Log open traffic data to
stdout
APIGW_LOG_OPENTRAFFIC_PAYLOAD=[true | false]
- true = Store copies of message payloads on disk
- false = Do not store copies of message payloads on disk
Best practices
When using the open logging feature, consider the following:
- Enabling the open traffic event log will have a performance impact:
- We recommend that you test the performance impact before using this feature in a production system.
- Enabling payload storage will consume additional system resources and slow down your overall TPS.
- Ensure that you have enough disk space available for storing open traffic event log files.
- Ensure that you implement a file retention policy for open traffic event log files, as API Gateway does not delete files automatically.
- If you enable payload storage, we recommend using fast disks (for example, SSD).