Monitoring and metrics
5 minute read
Monitor services in API Gateway Manager
This section explains how to monitor example services using the API Gateway Manager monitoring tools. For example, real-time monitoring metrics, message traffic monitoring, and performance statistics.
- API Gateway Manager is designed as an operational diagnostics tool only. API Gateway Analytics is recommended for monitoring and reporting of large volumes of historical data. For more details, see the API Gateway Analytics User Guide.
Before you start
- Ensure that the API Gateway, Admin Node Manager, and API Gateway tools are running.
- Ensure that real-time monitoring and traffic monitoring are enabled:
- In the Policy Studio tree, select Server Settings > Monitoring.
- To enable traffic monitoring, select Traffic Monitor > Enable Traffic Monitor.
- To enable real-time monitoring, select Real Time Monitoring > Enable Real Time Monitoring.
Note
Enabling traffic monitoring might have a negative impact on performance. To maximize performance, disable these settings. For more details, see Traffic monitoring settings.View real-time monitoring
You can view a wide range of monitoring data in the API Gateway Manager. For example, this includes message status, message traffic, filter execution path, message content, system, services, and remote hosts. You can view real-time traffic monitoring summary data on the main Dashboard tab in the TRAFFIC section.
Each time you send messages through the API Gateway to a service, the message status is displayed in the TRAFFIC section.
View traffic monitoring
You can use the traffic monitoring tools in API Gateway Manager for operational diagnostics and root cause analysis. The Traffic view provides a web-based message log of the HTTP, HTTPS, JMS, and FTP traffic processed by the API Gateway. You can perform tasks such as the following:
- Filter messages on a range of criteria (for example, transaction ID, service name, or remote host)
- Drill down to view message contents
- View performance statistics (for example, number of requests, average bytes sent, or average duration)
For example, you can click the Traffic button in the API Gateway Manager to view summary information for each message sent to the API Gateway. Alternatively, you can click one of the summary charts displayed on the Dashboard; Passed, Blocked or Exceptions. This displays the message traffic automatically filtered according to your selection.
Filter message traffic:
In the SELECTION pane on the left of the Traffic tab, click the Apply button to filter the messages based on default criteria such as REQUEST FROM(Client or API Gateway), MAX RESULTS PER SERVER, TRANSACTION STATUS, and TIME INTERVAL.
Note
When the Transaction Status filter is set to Block, it also matches transactions blocked by threat protection on request in order to maintain consistency between what appears on the Blocked widget and what is shown when redirected from the widget to Traffic Monitor.Click Add Filter to define your own filter criteria (for example, Service Name, Remote Host, Authentication Subject, Transaction ID, and Operation).
API Gateway inserts a transaction ID in all HTTP and HTTPS traffic in a header named X-CorrelationID.
Filter JMS traffic by custom property:
To filter JMS traffic using a custom property as a filter criteria, enter the property name and optionally the property value.
Both fields are case-sensitive.
- If only a property name is provided, all transactions with the specified property are displayed.
- If a property value is provided, all transactions where
name=valueare displayed (for example,MyProp=Value1).
View message content
When you click a selected message listed on the Traffic tab, this displays the message filter execution path and the contents of each request message and response message.
Click Save Request or Save Response to download the message contents and save them to a file.
View performance statistics
The Performance tab displays performance statistics for the HTTP and HTTPS traffic processed by the API Gateway. These include the number of requests, average bytes sent, and average duration.
Filter performance statistics
Click the Apply in the left pane to filter the performance statistics displayed based on different criteria. By default, the statistics are grouped by path name, with a time interval of 1 day. You can select different criteria from the GROUP BY and TIME INTERVAL lists.
Detect malformed messages
Messages with malformed content or an incorrect relative path are blocked by the API Gateway and displayed on the Dashboard tab in the TRAFFIC section.
Click the chart to display the list of blocked messages automatically filtered on the Traffic tab. Click a message in the list to display the filter execution path and message content.
Note
When a blocked message has failed in the gateway, this means that a filter executed in a policy has returned a failure status. When a blocked message generates an exception, this means that a filter executed in a policy has aborted (thrown an exception).Monitor real-time metrics
The Monitoring view enables you to monitor successes, failures, exceptions, and real-time metrics for the following:
- System: Metrics for memory, disk space, and CPU.
- API Services: Metrics for messages and processing times.
- API Methods: Metrics for messages and processing times.
- Clients: Metrics for messages.
- Remote Hosts: Metrics for transactions, bytes sent and received, and response times.
For example, on the System tab, when you click a panel in the ALL SYSTEMS section at the top, a graph for the selected setting is displayed below. The following example shows the graph displayed for the System CPU Avg (Max) setting selected on the right:
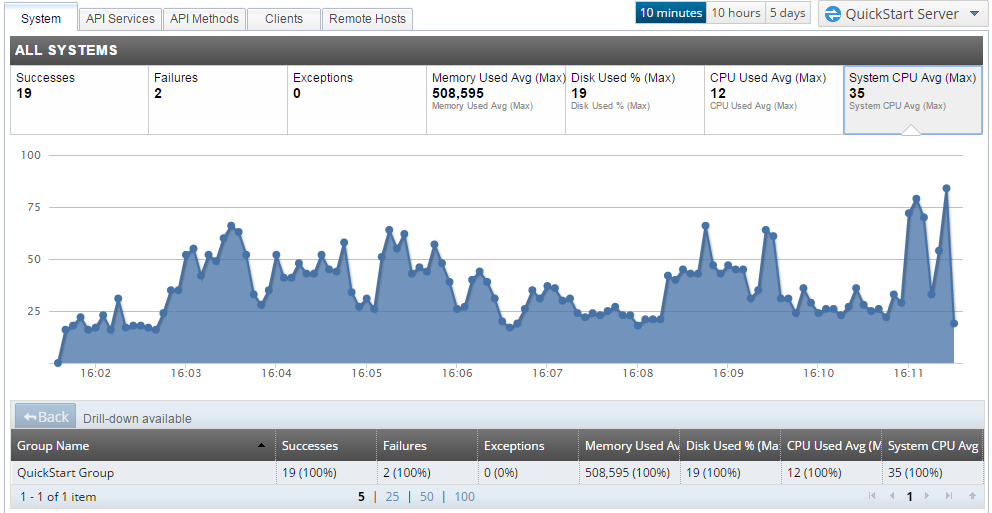
Drill down to view metrics for specific components at the bottom (for example, for a specific API Gateway group or instance, service, client, method, or remote host). You can also configure the metrics time window on the right (for example, 10 minutes, 10 hours, or 5 days).
Configure dynamic trace, logging, and monitoring
Click the Settings > Dynamic tab to configure trace, logging, and monitoring settings on-the-fly. These are dynamic settings, which means that you do not need to refresh or deploy to the API Gateway. For example, you can specify these settings for an API Gateway system, instance, service, interface, or path. For more details, see Configure API Gateway logging and events.
Configure metrics
To configure an API Gateway and Node Manager to store metrics on historic traffic in a relational database, see Configure API Gateway with the metrics database.
For details on purging old data from a metrics database, see Purge the metrics database.