Get started with API Gateway Analytics
14 minute read
Start API Gateway Analytics
To launch API Gateway Analytics, perform the following steps:
-
Start the API Gateway Analytics server using the
analyticsscript in the/bindirectory of your API Gateway Analytics installation. -
Using the default port, connect to the API Gateway Analytics interface in a browser at the following URL:
https://HOST:8040/HOSTpoints to the IP address or hostname of the machine on which API Gateway Analytics is installed. -
Log in using the username and password that you selected when installing API Gateway Analytics.
Start API Gateway Analytics as a service
You can also run the API Gateway Analytics server as a service by creating a script. A sample script and ReadMe is provided in the following directory:
INSTALL_DIR/analytics/posix/samples/etc/init.d/
Note
If you change to another metrics database that has a different set of remote hosts or clients configured, you must restart both API Gateway and API Gateway Analytics.Change the default API Gateway Analytics credentials
You can change the default API Gateway Analytics user credentials by editing your API Gateway Analytics configuration in Policy Studio under Environment Configuration > Users and Groups.
The default admin user is local to API Gateway Analytics. Updating these credentials does not affect access to other Axway products.
Replace the default sample certificate for API Gateway Analytics
The default Samples Test Certificate certificate used for SSL/TLS is self-signed by Axway. You can replace this default sample certificate by editing the API Gateway Analytics configuration in Policy Studio:
- Create a new project from an existing configuration, and select the configuration in
INSTALL_DIR/analytics/conf/fed. - Select Environment Configuration > Certificates and Keys, and add your own user-signed certificate.
- Select Environment Configuration > Listeners > Axway Analytics > Management Services > Ports, and edit the Reporter HTTP Interface.
- On the Network tab, click X.509 Certificate to change the SSL certificate.
- Save the project, and copy your Policy Studio project files back to your API Gateway Analytics installation. For example, copy the
.xmlfiles inusers/apiprojects/my-projecttoINSTALL_DIR/analytics/conf/fed.
Monitor traffic
API Gateway Analytics monitors, records, and reports on the history of message traffic between API Gateway instances and various services, remote hosts, and clients running in an API Gateway domain.
You can use API Gateway Analytics to monitor traffic and perform root cause analysis at the level of the domain, API Gateway instance, service, remote host, and client. You can also filter the display based on any selected time period. For example, this defaults to the last 7 days, but you can specify any date range.
Tip
API Gateway Analytics produces reports based on metrics stored by API Gateway when processing messages. To produce a graph showing the number of connections made by API Gateway to a service, you must first configure a policy that routes messages to that service. When this policy is configured, send messages through the policy so they are routed to the target service.Monitor the API Gateway system
The API Gateway Analytics System view includes the following tabs:
- Systems
- System Resources
Monitor system-level metrics
On the Systems tab, click a panel in the SYSTEMS section at the top to display graph for the selected system-level metrics below. For example, the available metrics include the following:
- Successes: The number of successful messages processed in the domain (that generated a success in an API Gateway policy).
- Failures: The number of blocked messages processed in the domain that generated a failure in an API Gateway policy.
- Exceptions: The number of blocked messages in the domain that generated an exception in an API Gateway policy.
- Active: The uptime of API Gateway instances.
- SLA breaches: The number of Service Level Agreement (SLA) breaches in the domain.
The following example shows messages successfully sent displayed in a simple domain with a single API Gateway instance:
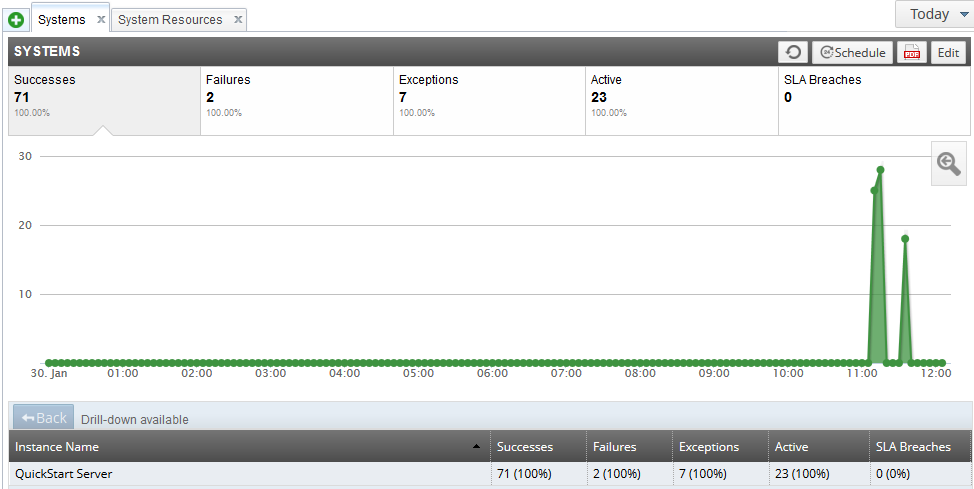
The table at the bottom shows all the API Gateway instances that are sending monitored traffic to protected services, clients, and remote hosts in your domain. You can click an API Gateway instance in the table to drill down and view graphs for the selected instance. Click Back on the left to return to the ALL SYSTEMS view.
Monitor system resources
On the System Resources tab, click a panel in the SYSTEM RESOURCES section at the top to display graph for the selected system resource metrics below. For example, the available metrics include the following:
- Instance CPU (Avg %): Average amount of CPU used by the API Gateway instance.
- System CPU (Avg %): Average amount of CPU used on the host machine running the API Gateway.
- Instance Memory Used (Avg MB): Average amount of memory used by the API Gateway instance.
- System Memory (Max MB): Maximum amount of memory used on the machine hosting the API Gateway. This includes memory used by the API Gateway and all other processes running on the machine.
- System Memory Total (Max MB): Total amount of available memory on the machine hosting the API Gateway.
The following example shows the average system CPU displayed in a simple domain with one API Gateway instance:
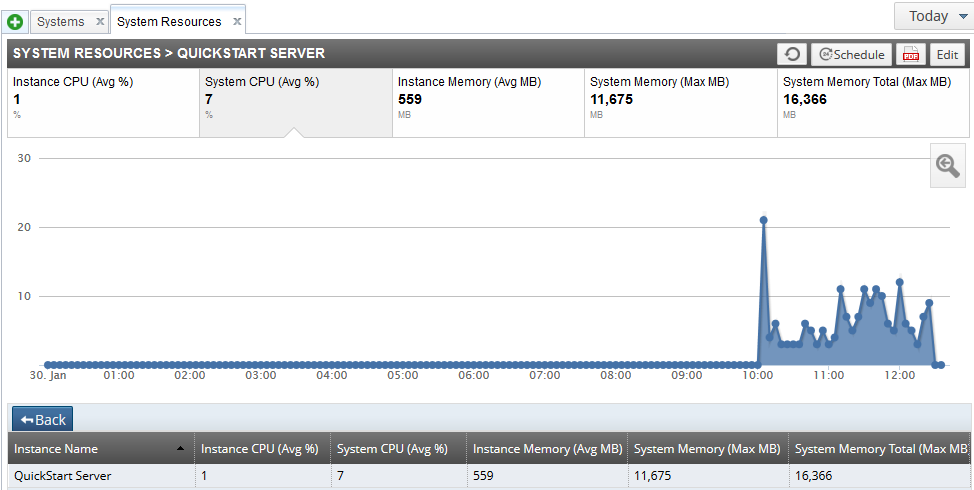
The table at the bottom shows all API Gateway instances that are sending monitored traffic to protected services, clients, and remote hosts in your domain. You can click an API Gateway instance in the table to drill down and view graphs for the selected instance. Click Back on the left to return to the SYSTEM RESOURCES view.
Monitor API services, methods, and clients
The API Services view shows metrics for services that are virtualized by API Gateway instances in your domain.
The API Services view includes the following tabs:
- Load Balance: Metrics for the number of messages and processing times.
- Clients (Service of): Metrics for the number of messages, successes, and failures.
- Clients: Metrics for the number of messages, successes, failures, and exceptions.
- API Services (Methods of): Metrics for the number of messages, successes, failures, and exceptions.
- API Services (Clients of): Metrics for the number of messages, successes, failures, and exceptions.
- API Services: Metrics for the number of messages, successes, failures, and exceptions.
- API Service Performance: Metrics for number of messages and processing times.
Example: API service performance
For example, In the API Services > API Service Performance tab, click a panel in the API SERVICE PERFORMANCE section at the top to display a graph for the selected service-level metric below. For example, the available metrics include the following:
- Messages: The number of API service messages processed in the API Gateway domain.
- Processing Time (Min ms): The minimum time taken to process a message, including all calls to remote servers.
- Processing Time (Max ms): The maximum time taken to process a message, including all calls to remote servers.
- Processing Time (Avg ms): The average time taken to process a message, including all calls to remote servers.
The following example shows the maximum processing time in a simple domain with multiple API services:
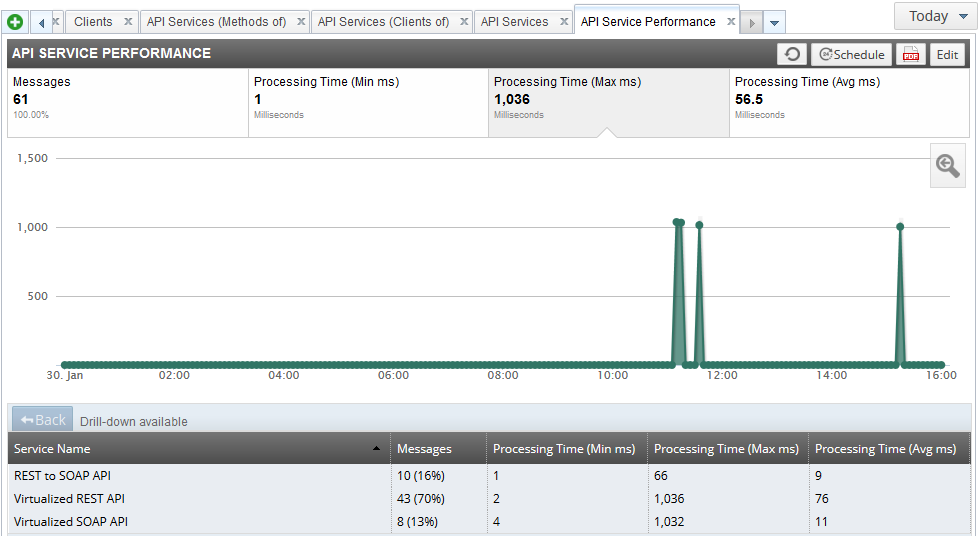
The table at the bottom shows all services protected by API Gateway instances in your domain. You can click a service in the table to drill down and view graphs for the selected service. Click Back on the left to return to the API SERVICE PERFORMANCE view.
Note
A service must first have been sent a message before it is displayed in the API Services view.Monitor remote hosts
The Remote Hosts view displays metrics for all the remote hosts that have been configured in your domain. It shows details such as the number of message transactions that have been sent to this remote host, together with the total number of bytes sent to and received from this host.
In the Remote Hosts view, click a panel in the REMOTE HOSTS section at the top to display graph for the selected remote host metric below. For example, the available metrics include the following:
- Transactions: The number of message transactions to remote hosts.
- Volume Bytes (In): The total number of bytes sent to remote hosts.
- Volume Bytes (Out): The total number of bytes received from remote hosts.
- Response Time (Avg ms): The average response time to remote hosts.
The following example shows the total number of bytes sent to remote hosts:
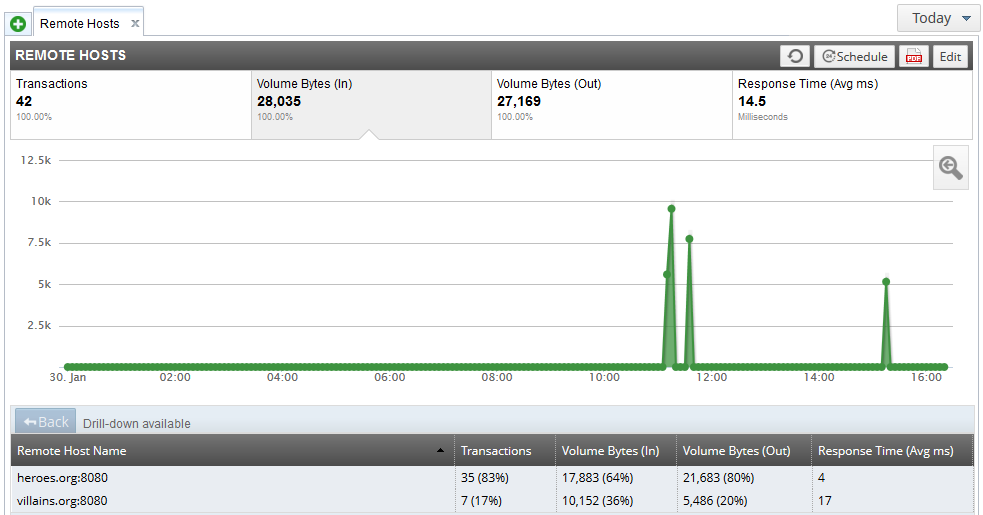
The table at the bottom shows all the remote hosts connected to by API Gateway instances in your domain. You can click a remote host in the table to drill down and view graphs for the selected remote host. Click Back on the left to return to the REMOTE HOSTS view.
Monitor protocols
The Protocols view enables you to monitor the different message protocols in your domain (for example, HTTP, Websocket, JMS, File Transfer, and so on). Click a panel in the INBOUND PROTOCOLS section at the top to display graph for the selected protocol metrics below. For example, the available metrics include the following:
- Successes: The number of successful messages that are processed in the domain.
- Failures: The number of failed messages that are processed in the domain.
- Exceptions: The number of messages that generated an exception in an API Gateway policy.
The following example shows the number of HTTP messages that generated an exception in the domain:
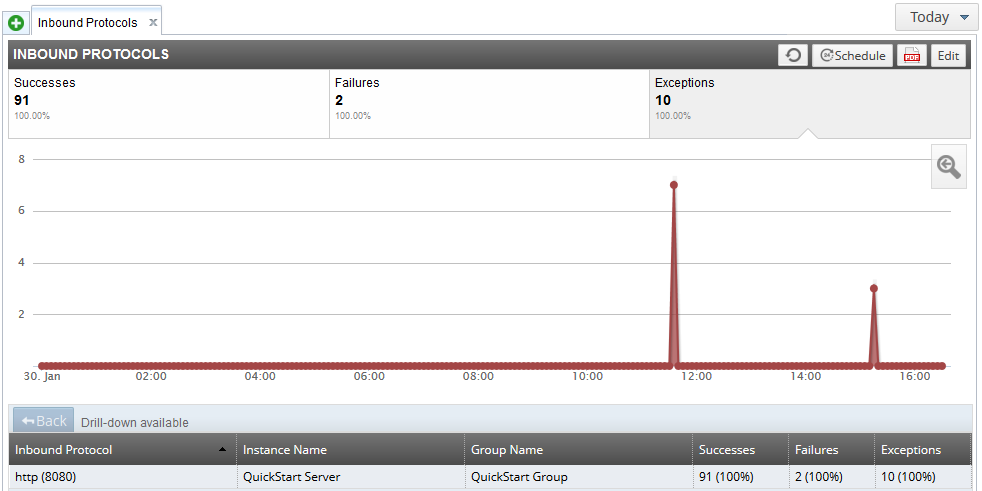
The table at the bottom shows all the protocols used by API Gateway instances in your domain. You can click a protocol in the table to drill down and view graphs for the selected protocol (for example, http 8080). Click Back on the left to return to the INBOUND PROTOCOLS view.
Audit transactions
The Transaction Audit Log view enables you to filter the transaction audit log messages messages generated by API Gateway instances in your domain. For example:
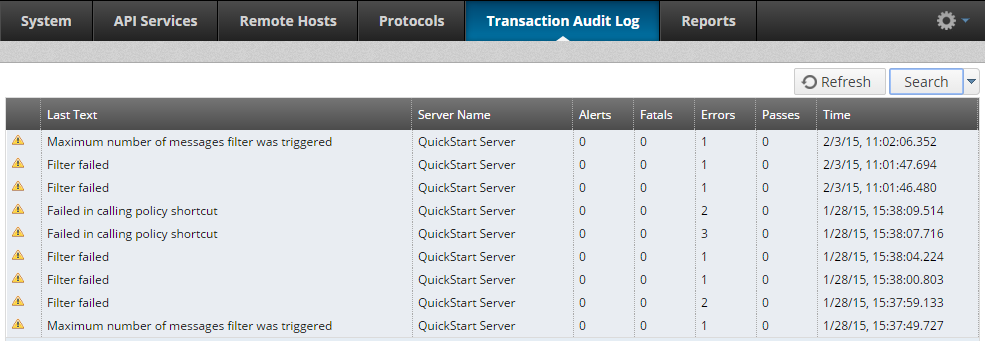
You can filter the log messages by clicking the Search button on the right in the toolbar. The Query Editor dialog enables you to create a query to filter log messages by details such as time period, severity level, filter type or name, and message text. When you have added your search criteria, click Search at the bottom to run the query. You can also save the query for later use.
When you click Search, the log messages that match the search criteria specified in the query are displayed in the table. For example, the details displayed in the table include the log message text, API Gateway name, alerts, and time. You can also double-click an item in the list for more details (for example, transaction ID, filter category, and filter name).
Note
To view data in the Transaction Audit Log tab, you must configure the API Gateway to write to the metrics database. In the Policy Studio tree, select Environment Configuration > Server Settings > Logging > Transaction Audit Log > Database.Schedule custom reports
API Gateway Analytics uses message metrics stored in a centralized metrics database by the Node Managers running in your domain. The Node Managers store metrics for the virtualized services exposed by the local API Gateway instances, and for the services, clients, and remote host connections that they protect.
API Gateway Analytics can generate usage reports and charts based on the stored metrics data, and enables you to configure custom reports to suit the needs of your environment. This includes viewing available metrics for each target report type, grouping and filtering metrics, and what to display on drill through.
You can schedule API Gateway Analytics reports to run on a regular basis, and to email the results to users in PDF format. These reports include summary values at the top (for example, the number of requests, SLA breaches, alerts triggered, and unique clients in a specified week) followed by a table of services, and their aggregated usage data (for example, the number of requests on each service).
The report data is for the configured current week of the report, which is compared to the week before. You can set the configured current week of the report to be the actual current calendar week or any prior week (provided there is corresponding data in the database).
Enable scheduled reporting in Policy Studio
To configure scheduled report settings in Policy Studio, right-click the Environment Configuration > Listeners > Axway Analytics node in the Policy Studio tree, and select Database Archive.
Database configuration
Click the browse button the right, and select a pre-configured database connection in the dialog. This setting defaults to the Default Database Connection. To add a new database connection, right-click the Database Connections node, and select Add DB connection.
You can also edit or delete existing nodes by right-clicking and selecting the appropriate option. Alternatively, you can add database connections under the Environment Configuration > External Connections node in the Policy Studio tree view.
Scheduled reports configuration
You can configure the following settings for scheduled reports:
- Enable Report Generation
- Select whether to enable scheduled reports in PDF format. When selected, by default, this runs a scheduled weekly report on Monday morning at 0:01. For details on configuring a different time schedule, see the next setting. This setting is not selected by default.
When Enable Report Generation is enabled, you can configure the following settings on the Report Generator Process tab:
- Connect to API Gateway Analytics as User
- Enter the user name and password used to connect to the report generator process. Defaults to the values entered using the
configureserverscript. - Output
- Enter the directory used for the generated report files in the Output Directory field, or click Choose to browse to the directory. Defaults to the directory entered using the
configureserverscript (for example,c:\temp\reports). You can also select to Do not delete report files after emailing. This setting is not selected by default.
SMTP configuration
When Enable Report Generation is enabled, you can configure the following settings on the SMTP tab. These settings default to those entered using the configureserver script.
- Email generated reports
- Select whether to email generated PDF report files. This is not selected by default.
- Do not delete report files after emailing
- Select whether to keep generated PDF report files after they are sent. Not selected by default.
- Email Recipient (To)
- Enter the recipient of the automatically generated email (for example,
user@mycorp.com). Use a semicolon-separated list of email addresses to send reports to multiple recipients. - Email Sender (From)
- The generated report emails appear from the sender email address specified here (for example,
no-reply@mycorp.com).
Note
Some mail servers do not allow relaying mail when the sender in the From field is not recognized by the server.- Outgoing Mail Server (SMTP)
- Specify the SMTP server used to relay the report email (for example,
smtp.gmail.com). - Port
- Specify the SMTP server port to connect to. Defaults to port 25.
- Connection Security
- Select the connection security used to send the report email (
SSL,TLS, orNONE). Defaults toNONE. - Log on Using:
- If you are required to authenticate to the SMTP server, enter the user name and password for authentication.
Create reports in a monitoring view
In API Gateway Analytics, in the System, API Services, Remote Hosts, and Protocols views, you can create reports by clicking Schedule on the right in the toolbar. For example, to generate reports on API Service clients, perform the following steps:
-
Click the API Services > Clients view.
-
Click Edit on the right in the toolbar to specify the report settings:
- Name: Defaults to the tab name (for example, Clients).
- Group by: Select how the report is displayed (for example, by Client Name, Instance Name, and so on). You can also select the metrics that are displayed (for example, Messages, Successes, and so on).
- Filter by: Select condition options to filter the display (for example, only show entries with a specific Client Name).
- Enable drill-down: Select this to use the value of the Group by columns to provide an additional drill-down report. You can choose to group by additional fields. This is enabled by default.
These filtering and grouping mechanisms enable you to answer questions such as what clients used an API Service, or which API services were used by a client. For example, to show clients that used
Service1, you can create a custom report that groups by Client Name and filters where Service Name isService1.The group-by mechanism only applies to the data table below the report chart. The chart remains the same.
-
Click Save in the toolbar.
-
Click Schedule in the toolbar.
-
You can also click the PDF button in the toolbar to generate a PDF version of the report.
You can follow a similar sequence of steps to generate reports in the System, Remote Hosts, and Protocols views.
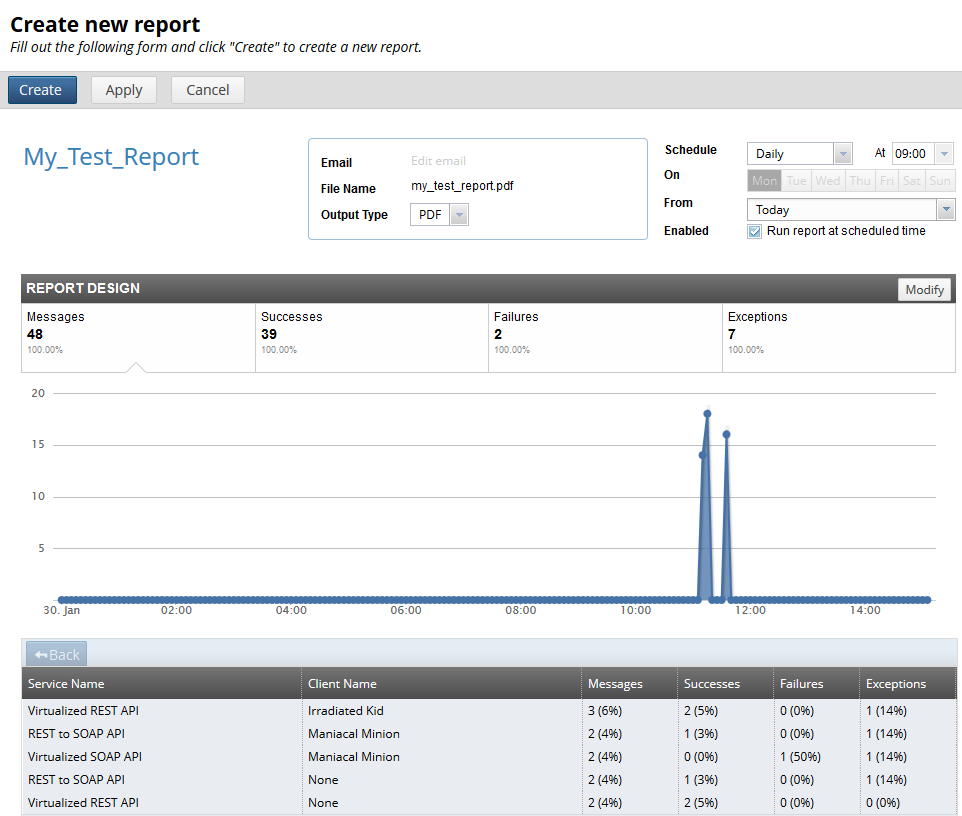
Using the reports view
Alternatively, you can create a report in the Reports view. Perform the following steps:
- Click New report on the left in the toolbar.
- Enter the report Name in the dialog.
- Select the report Type, and click OK.
- Configure the schedule and output options on the right as appropriate.Defaults to PDF output daily at 9am, starting from today.
- Click Apply to save your settings.
- Click Create to create the report.
The following example shows a custom report grouped by Service Name:
When you have created a report, you can select it in list on the Managing Reports page, and click Generate now. Alternatively, click Delete to remove the report from the list.