Monitor APIs and applications in API Manager
6 minute read
API administrators and organization administrators can use the Monitoring tab in API Manager to view metrics on all invoked APIs and client applications in the system.
For example, the metrics displayed on the Monitoring tab include the number of messages, successes, failures, and processing time per-invoked API, or per-client application, over a user-defined time range. This view shows the APIs and client applications that you manage, or have access to view. It only shows APIs and applications when there is data for these APIs and applications in the user-defined time range.
The monitoring data is obtained from the metrics database, and the data points are written to the database in 5 minute and 1 hour intervals. At a minimum, applications invoking APIs do not have data available until the end of a 5 minute time window. Similarly, hourly data only becomes available at the start of every hour.
You can filter the metrics displayed on the Monitoring tab based on specified APIs, methods, organizations, and applications.
Prerequisites
To enable monitoring in API Manager, perform the following steps:
-
Add the JDBC driver files for your chosen metrics database to your API Gateway installation. For example:
INSTALL_DIR/apigateway/ext/lib/mysql-connector-java-5.x-bin.jar -
Ensure that your metrics database is running, and run the following command to configure your metrics database tables:
INSTALL_DIR/apigateway/posix/bin/dbsetup dbsetup --dburl=jdbc:mysql://localhost:3306/DefaultDb --dbuser=root --dbpass=changeme --reinstall -
Use the
managedomaincommand to enable metrics for your Admin Node Manager host. For example:managedomain --edit_host --host=ADMIN_NODE_MNGR_HOST --metrics_enabled=True --metrics_dburl=jdbc:mysql://localhost:3306//DefaultDb --metrics_dbuser=root --metrics_dbpass=changeme --username MY_NAME --password MY_PWD -
In the Policy Studio tree, select Server Settings > API Manager > Monitoring to enable API Manager monitoring and configure your metrics database. Remember to click Save at the bottom, and click Deploy in the toolbar.
Alternatively, you can automate this using a preconfigured
.fedfile. For example:managedomain --deploy -g GROUP_NAME --username admin --password changeme --archive_filename /tmp/deploy2.fed -
Restart the API Gateway instance and Admin Node Manager.
For more details on setting up a metrics database, see Configure the metrics database.
Monitor APIs in API Manager
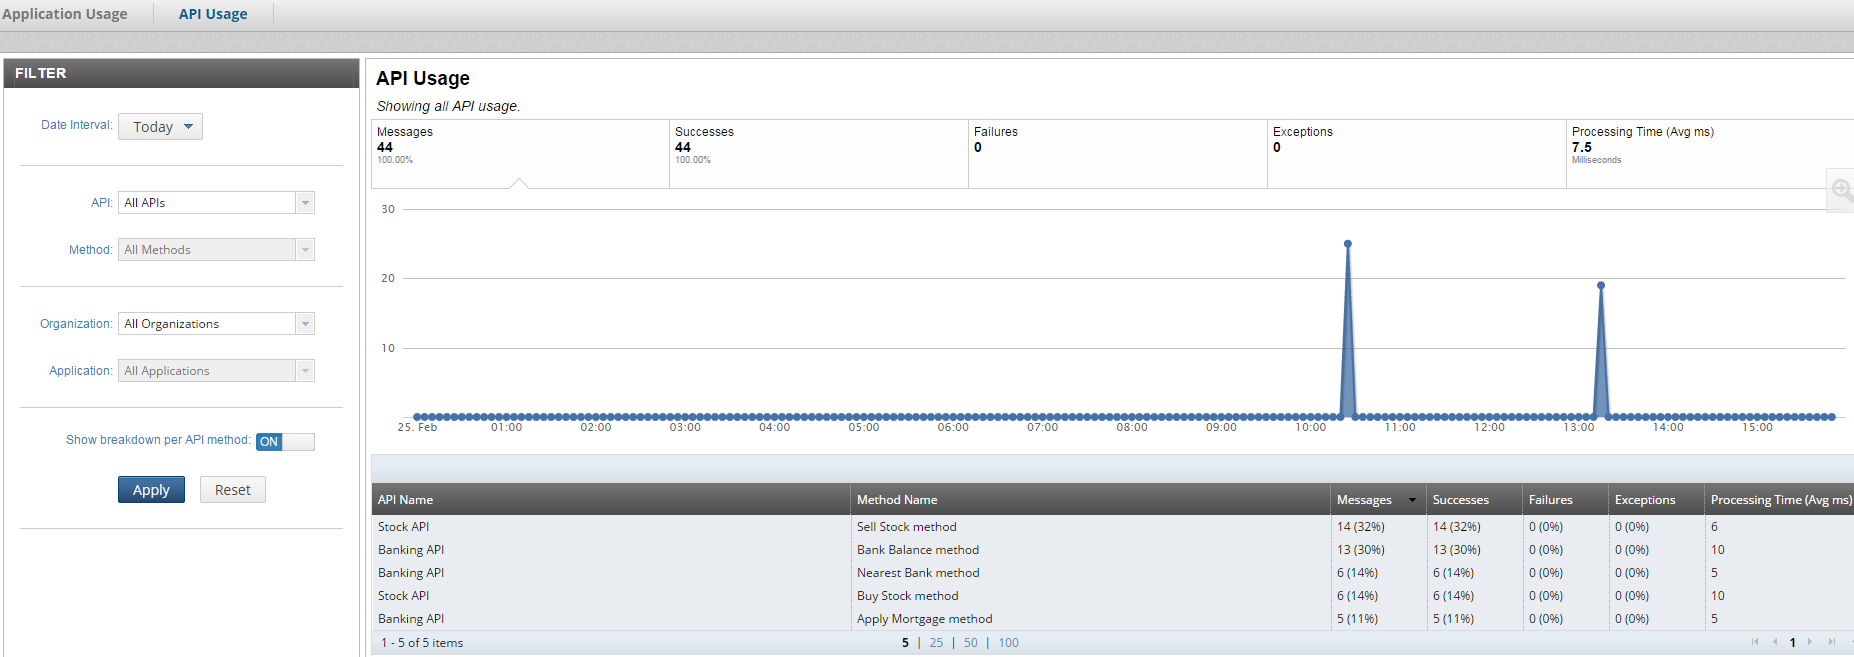
The Monitoring > API Usage view enables you to monitor the number of messages, successes, failures, and average processing time per-invoked API, over a specified time range.
The following shows the metrics displayed for some example banking APIs:
Monitor applications in API Manager
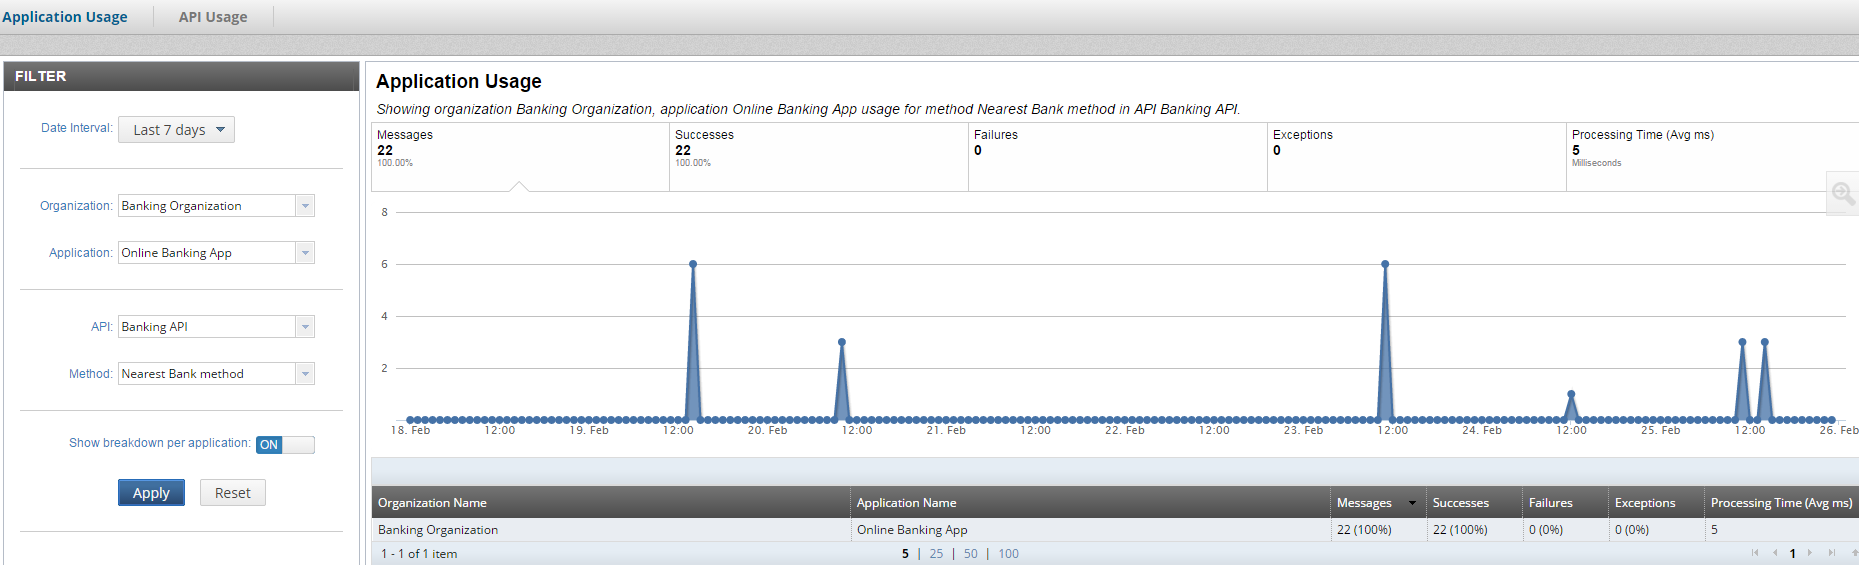
The Monitoring > Application Usage view enables you to monitor the number of messages, successes, failures, and average processing time per-invoked client application, over a specified time range.
The following shows the metrics displayed for a selected client application:
Monitoring metrics
In API Gateway, messages are processed by policies. The status of the policy execution can be one of:
- Success or Passed: The policy is successfully executed and returns
true. For example, a happy path execution. - Failure or Blocked: The policy is successfully executed and returns
false. For example, a handled error condition happened. - Exception or Aborted: The policy is not executed as planned and aborts execution. For example, an unhandled error happened.
You can monitor the following metrics in both the API Usage and Application Usage views:
- Messages: The number of messages processed by the selected API or client application.
- Successes: The number of successful messages processed (that generated a success in an API Gateway policy).
- Failures: The number of failed messages processed (that generated a failure in an API Gateway policy).
- Exceptions: The number of messages that generated an exception in an API Gateway policy.
- Processing Time (Avg ms): The average time taken to process a message, including all calls to remote servers.
Filter metrics data
In both the API Usage and Application Usage views, you can use the FILTER panel on the left to filter the metrics data displayed in the graph and table on the right. By default, today’s data for all APIs, methods, organizations, and applications is displayed.
Date interval
You can select a date interval instead of the default value of Today (for example, Last 7 days, Last 30 days, or a custom date range).
- Today and Specify date/time: Returns data from the current day up to the last interval processed.
- All other date intervals: Return full days, but only up to the end of yesterday. It does not include data from today.
You must click Apply or Reset to update the metrics graph and table on the right.
APIs and methods
You can use the API field to display data for All APIs or for a specific API. If you select a specific API, this enables the Method field. You can select All Methods or a specific method associated with the selected API.
Organizations and applications
You can use the Organization field to display data for All organizations or for specific organization. If you select a specific organization, this enables the Application field. You can select All Applications or a specific application associated with the selected organization.
When filter fields are selected, you can start typing characters. All entries in the list that match on the starting characters are displayed. The search is not case-sensitive.
If there are many entries in a list, the data is paginated, and the first 10 elements are displayed along with the option of viewing more entries.
Show breakdown per API method
In the API Usage view, when the Show breakdown per API method option is selected, the table on the bottom right displays totals grouped by API Name and Method Name. This option is selected by default.
When Show breakdown per application is not selected, the table displays totals grouped by API Name only. There is no breakdown by Method Name and the method name is not displayed in the table.
Show breakdown per application
In the Application Usage view, when the Show breakdown per application option is selected, the table on the bottom right displays totals grouped by Organization Name and Application Name. This option is selected by default.
When Show breakdown per application is not selected, the table displays totals grouped by Organization Name only. There is no breakdown by Application Name and the application name is not displayed in the table.
Unlike the table, the graph will display the same data, regardless of whether the show breakdown settings are selected.
If you select an individual row in the table, the graph is automatically updated to contain data for the selected row only. If you deselect the row, the chart is automatically updated to contain data for all rows, which is the default behavior.
Apply the filter
When you click Apply, the graph and table on the right are refreshed to contain data associated with the selected search filters. The options available in the filter lists are also refreshed to include any new changes (for example, any new APIs added).
Reset the filter
When you click Reset, the default selections is restored. This includes data for Today, for All APIs, All Methods, All Organizations and All Applications.The options available in the filter lists are also refreshed to include any new changes (for example, any new APIs added).
In all cases, the graph and table on the right are not refreshed until you select Apply or Reset.
If you select an API that is not related to the selected organization, the graph and table will be empty and the grid will display No data. This is not an error.